
South Africa’s office market continues to recover. According to the SAPOA Office Vacancy Survey, the national vacancy rate improved to 12.6% in Q1 2026 — the lowest level since the second quarter of 2020, before the impact of the COVID-19 pandemic.
The survey covers 2,722 completed office properties and active developments across 54 nodes, totalling roughly 19.3 million m² of gross lettable area. Of the 54 nodes surveyed, vacancy improved in 27 and deteriorated in 20.
For Cape Town landlords and tenants, the story is sharper: the metro is the strongest-performing major market in the country, with overall vacancy at just 6.0% and decentralised vacancy at a remarkable 2.7%.
Headline Results
National office vacancy peaked at 16.8% in mid-2022. Since then, the market has steadily clawed back occupancy as occupiers re-engage with the workplace, hybrid working stabilises, and limited new supply tightens the market.
Asking rentals have responded in kind, with year-on-year growth reaching 6.7% in the current quarter. In inflation-adjusted terms, however, asking rentals across many of the country’s major office nodes remain below their 2019 levels — a reminder that the income and capital-value recovery is still in progress.
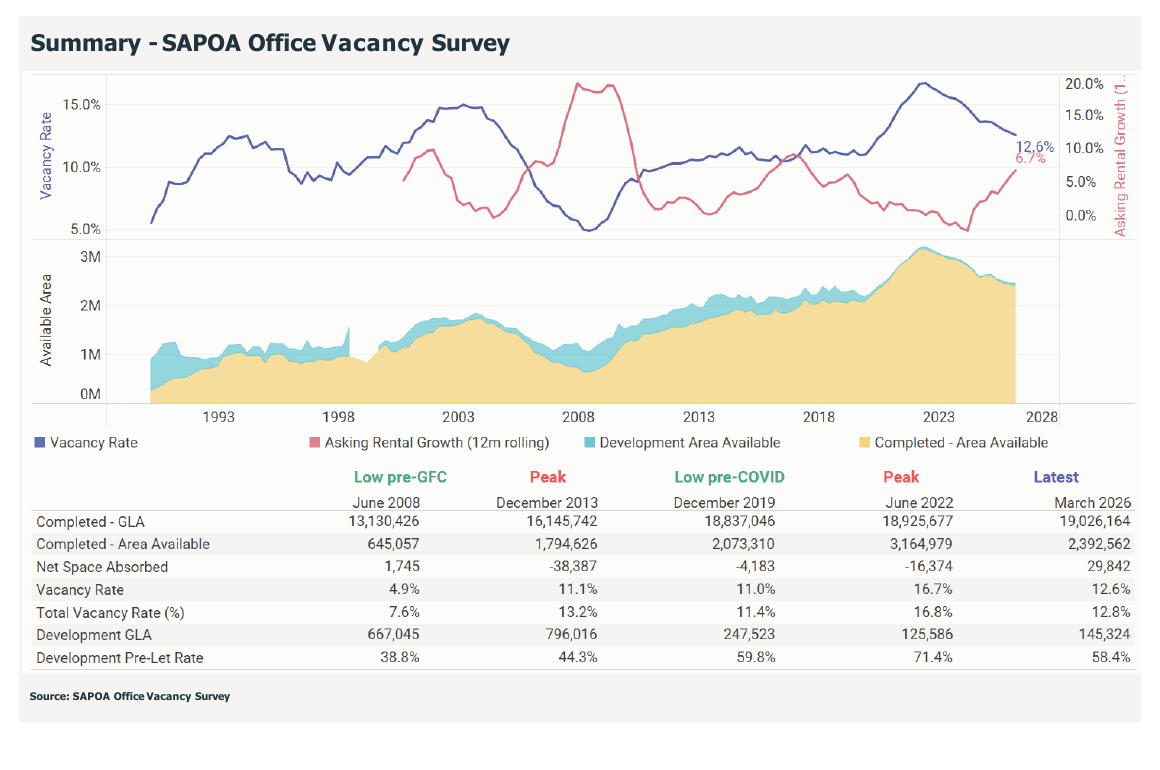
The most important nuance: while the vacancy rate has improved meaningfully, the absolute volume of vacant space — roughly 2.4 million m² nationally — remains well above prior cycles. The market has grown, so the income at risk for landlords has grown with it.
The Flight to Quality is Real — and Widening
Performance by office grade tells a story of two markets. Prime and A-grade buildings continue to absorb the bulk of leasing activity, while older, less adaptable B- and C-grade stock remains under pressure.
| Grade | Q1 2026 Vacancy | Quarter-on-Quarter Shift |
|---|---|---|
| Prime | 5.1% | −0.9% |
| A-Grade | 10.1% | −0.5% |
| B-Grade | 16.7% | +0.2% |
| C-Grade | 16.8% | +0.3% |
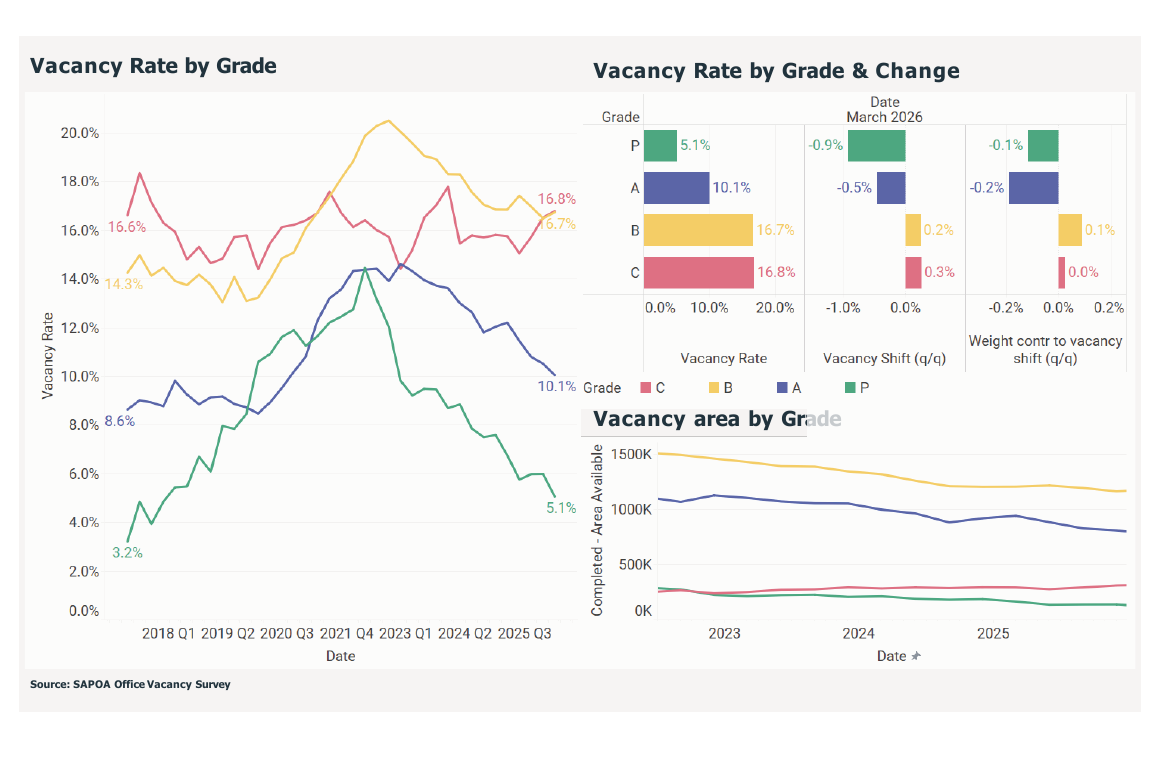
Prime vacancy has fallen sharply from its 2022 peak as occupiers downsize their footprint while upgrading the quality of the space they take. Crucially, the rental gap between Prime and A-grade space is now narrow enough that the upgrade decision often makes economic sense — especially when factoring in energy resilience, ESG credentials, and tenant amenities.
B- and C-grade buildings, by contrast, face a structural problem. Many sit on inefficient floorplates, lack the power and air-conditioning infrastructure that modern tenants expect, and are difficult to reposition for residential or alternative uses. This segment will remain the largest drag on the national recovery.
Cape Town Leads, Johannesburg Trails
Regional performance is increasingly uneven. Cape Town remains the strongest-performing metro in the country by some distance, while Johannesburg continues to carry the heaviest legacy of pandemic-era oversupply.
| Metro | Q1 2026 Vacancy | Notes |
|---|---|---|
| Cape Town | 6.0% | Strongest metro; broad-based node recovery |
| Tshwane | 9.9% | Government tenancy anchors CBD demand |
| Durban | 11.7% | Steady gains in decentralised nodes |
| Gqeberha (Nelson Mandela Bay) | 15.3% | Recovery uneven |
| Johannesburg | 15.5% | Improving from 19.5% peak but still elevated |
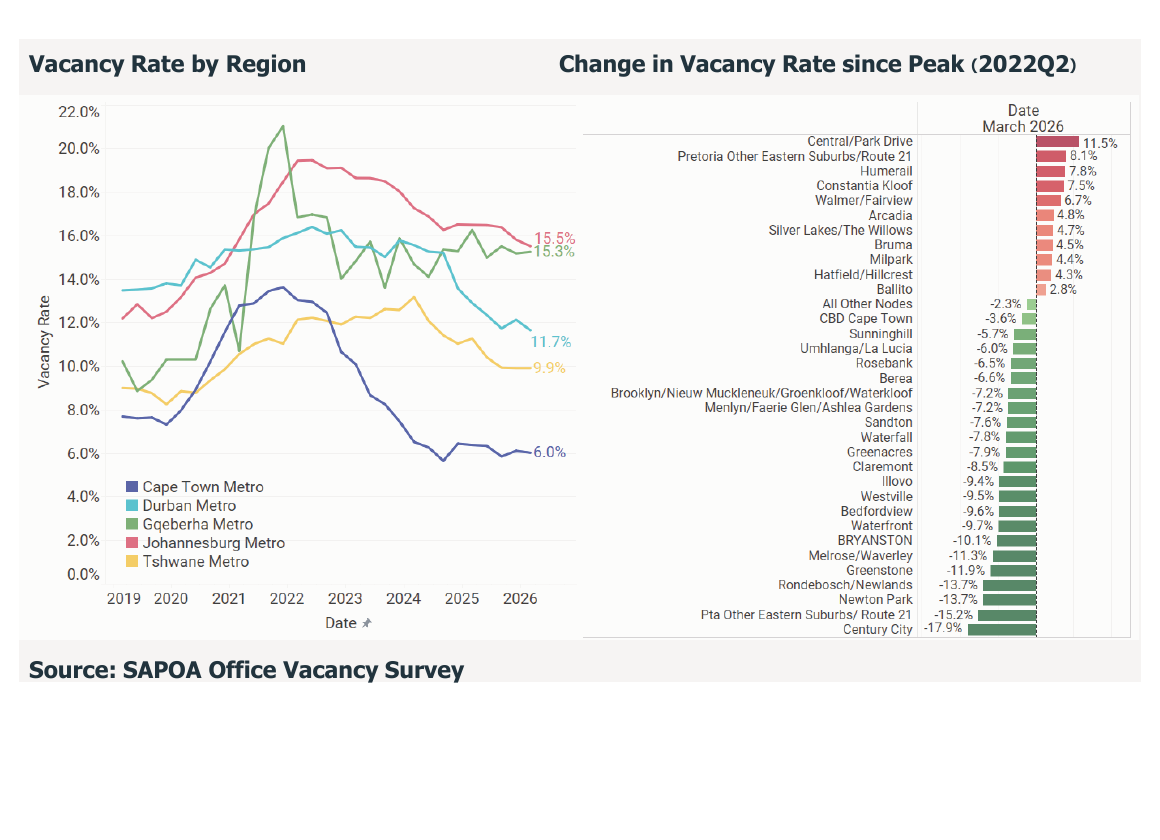
The largest vacancy improvements since the 2022 peak have all come from Cape Town and Tshwane nodes. Century City has compressed by 17.9%, followed by Pretoria’s Eastern Suburbs/Route 21 (−15.2%), Newton Park (−13.7%), and Rondebosch/Newlands (−13.7%).
A handful of nodes have moved in the other direction over the same period — most notably Central/Park Drive, Pretoria Other Eastern Suburbs, Humerail, Constantia Kloof, and Walmer/Fairview — but the broader trend is unmistakable: this recovery is real, and it is led from the south.
Decentralised Nodes Continue to Outperform CBDs
Decentralised office nodes continue to attract tenants ahead of traditional CBDs. The national gap is wide: decentralised vacancy sits at 11.5%, compared with 16.1% in CBDs. Occupiers are voting with their leases for accessible, amenity-rich, lower-friction locations that work for hybrid teams.
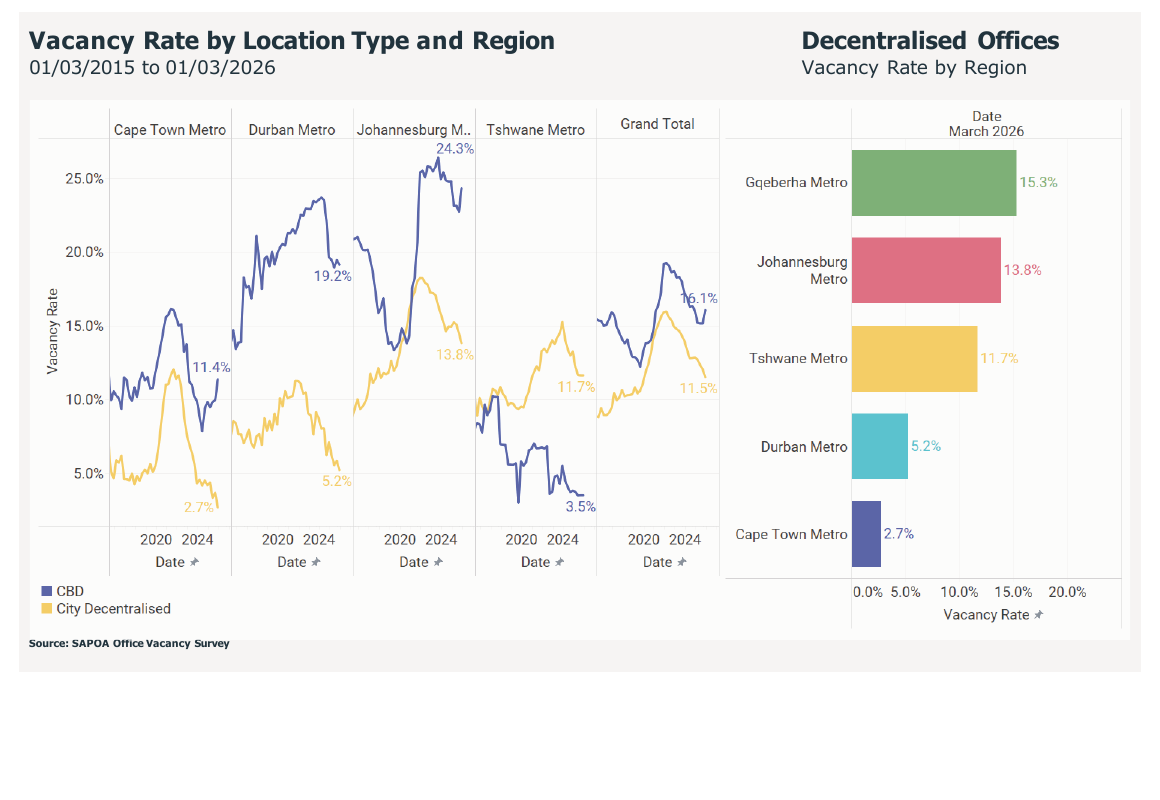
Cape Town is the most striking case. Its decentralised vacancy of 2.7% is the lowest of any major market in the country — effectively full occupancy by industry standards. Even Johannesburg’s decentralised performance (13.8%) materially beats its own CBD.
The one exception is Tshwane, where the CBD vacancy of 3.5% is significantly lower than most decentralised nodes. National and provincial government tenants continue to underpin demand in central Pretoria in a way no other CBD enjoys.
A Closer Look at the Cape Town Nodes
Drilling into the Cape Town node data sharpens the picture considerably. Premium decentralised precincts are at or near full occupancy, while the CBD continues to carry the metro’s elevated B- and C-grade vacancy.
Cape Town Office Vacancy by Node — Q1 2026
| Node | Total GLA (m²) | Vacancy Rate | Gross Asking Rental (Median, R/m²) |
|---|---|---|---|
| V&A Waterfront | 144,572 | 0.4% | R320 |
| Rondebosch / Newlands | 111,606 | 1.4% | R215 |
| Century City | 383,248 | 1.7% | R197 |
| Central (Pinelands & Black River Park) | 369,716 | 3.0% | R185 |
| Bellville | 547,187 | 3.3% | R168 |
| Claremont | 146,910 | 5.5% | R214 |
| CBD Cape Town | 1,058,085 | 11.4% | R154 |
What stands out: the V&A Waterfront is effectively full at 0.4% vacancy, and commands the highest median asking rental in the metro at R320/m². Rondebosch/Newlands, Century City, Central, and Bellville are all comfortably below 4% — the kind of numbers that mean tenants searching for quality space in these nodes are competing for a shrinking pool of options.
The CBD Cape Town vacancy of 11.4% looks higher in isolation, but the underlying detail matters: Prime CBD vacancy is 5.7% and A-grade is 5.8%, while B-grade sits at 14.8% and C-grade at 17.8%. The CBD’s flight-to-quality dynamic is more pronounced than the headline number suggests, and well-located A-grade CBD stock is moving briskly.
Of the active development pipeline in Cape Town, the Central node leads with 45,000 m² under construction at a median asking rental of R335/m² — a strong signal of developer confidence in the precinct. Century City and the CBD have smaller pre-let projects underway.
Development Pipeline Remains Thin
National office development activity is running at just 0.8% of existing stock, with around 145,324 m² under construction — well below the long-term average of roughly 490,000 m². New projects continue to be largely tenant-driven, with a current pre-let rate of 58.4%.
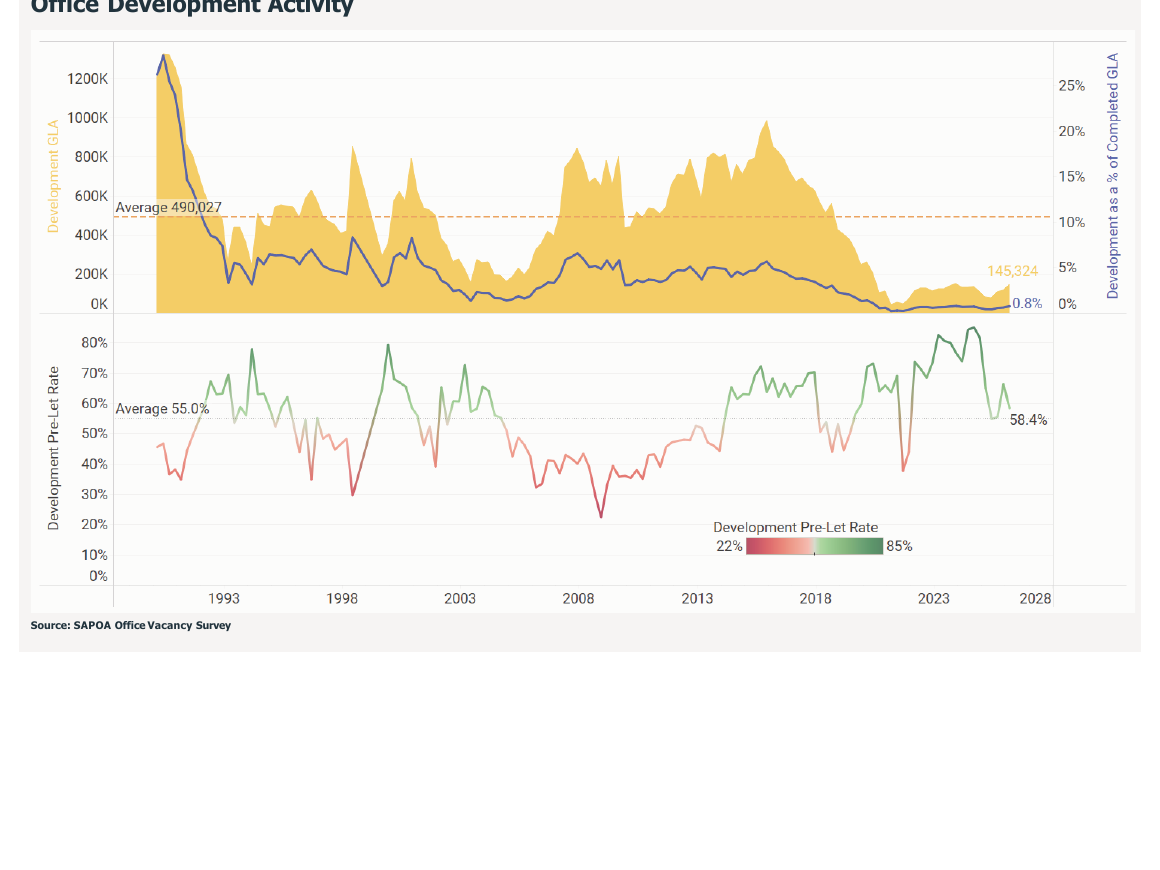
This is good news for owners of existing high-quality stock. With limited speculative supply coming online, the tightening seen in Prime and A-grade vacancy is unlikely to be undone by a new wave of competing buildings. The next 18–24 months should support continued rental recovery in the better-located, better-specified portion of the market.
Distressed Mid-Quality Stock is the Drag
As of March 2026, 51% of all vacant office space nationally was concentrated in buildings that were at least half empty. The B-grade segment is most exposed — 59% of its vacancy sits in buildings that are at least 50% empty, and 81% in buildings with vacancy of 30% or higher.
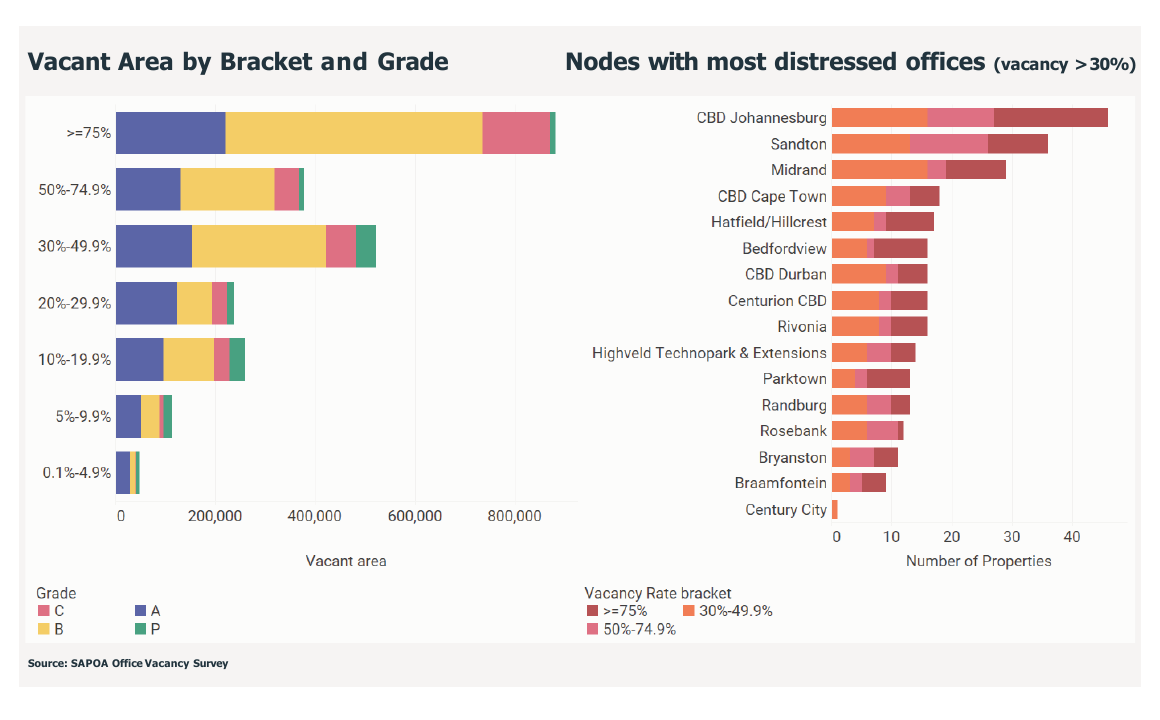
These distressed assets are hard to fix. Many have deep, inefficient floorplates that don’t convert easily to residential. Others are constrained by financial realities — carrying values that make a full repositioning infeasible. The presence of shadow space (where long-term tenants occupy only part of a building) further complicates upgrade strategies.
The CBD Johannesburg, Sandton and Midrand nodes carry the highest count of distressed properties nationally. CBD Cape Town also features, with around 17 properties in the >30% vacancy bracket — the dynamic to watch in Cape Town is whether this stock gets repositioned, sold to alternative-use developers, or continues to weigh on the broader metro’s asking rentals.
Micro-Location Increasingly Decides Outcomes
One of the more important shifts in the SAPOA Q1 2026 report is the emphasis on micro-location dynamics within nodes. The headline node-level vacancy figure increasingly conceals significant variation street by street and building by building.
The report uses Rosebank in Johannesburg as a case study — an overall vacancy of 7.8% masks Prime and A-grade vacancies ranging from 1.5% in the strongest sub-precinct (Oxford Road north of Jellicoe) to 15.2% in the weakest (Sturdee/Cradock).
The same logic applies in Cape Town. Within the CBD, the V&A Waterfront-adjacent stock is performing in line with the Waterfront itself, while older Foreshore and Loop Street B-grade buildings struggle. Within Century City, newer buildings on Bridgeways and Park Lane are tightly let, while older periphery stock takes longer to absorb. Granular, building-level intelligence is now essential for any leasing, acquisition or asset-management decision.
What This Means for Cape Town Landlords and Tenants
For landlords
- • Premium decentralised Cape Town stock is the strongest position in the country. Reletting risk is low; the focus should be on locking in rental escalations and renewing anchor tenants ahead of expiry.
- • The Prime/A-grade rental gap remains narrow. Targeted capex on lobbies, energy resilience and tenant amenities continues to deliver outsized leasing returns.
- • B- and C-grade owners with deep vacancy need to make a clear-eyed call: invest meaningfully to reposition, change use, or accept that the asset is now a yield play at a discounted rental.
For tenants
- • The Cape Town leasing market is no longer a tenant’s market in premium decentralised nodes. Plan space requirements 12–18 months ahead of need, especially in the V&A Waterfront, Century City, Newlands, and Bellville.
- • Real opportunity remains in CBD Cape Town A-grade and selective B-grade buildings, where rentals are still meaningfully below decentralised equivalents.
- • Energy resilience, fibre, parking ratios and ESG credentials are no longer differentiators — they are baseline expectations from any quality building.
Key Takeaways
- • National office vacancy improved to 12.6% in Q1 2026 — the lowest level since mid-2020.
- • Flight to quality continues: Prime vacancy is 5.1%, A-grade 10.1%, while B- and C-grade sit above 16%.
- • Cape Town leads the national recovery with overall vacancy of 6.0%, and decentralised vacancy of just 2.7%.
- • The V&A Waterfront is essentially full at 0.4% vacancy with median asking rentals of R320/m².
- • Century City posted the largest vacancy compression nationally since the 2022 peak (−17.9%).
- • New development is subdued at 0.8% of stock with a 58.4% pre-let rate — limiting future supply risk in the better-located segments.
- • Over half of national vacant space is concentrated in deeply distressed buildings — concentrated in CBD Johannesburg, Sandton and Midrand.
- • Micro-location matters more than ever: street-level and building-level intelligence now drives leasing and acquisition decisions, not node averages.
Need Cape Town Office Market Intelligence?
Headline numbers only get you so far. Whether you’re re-leasing a portfolio, hunting for the right space, or evaluating an acquisition in the Cape Town office market, Baker Street Properties brings building-level, node-level and tenant-level intelligence to every conversation.
Source: SAPOA / MSCI / Gmaven Office Vacancy Survey, Q1 2026.
Get in Touch