
South Africa’s office market recovery is broadening. According to the SAPOA Office Vacancy Survey, the national vacancy rate improved to 12.1% in Q2 2026 - down from 12.6% in the first quarter and the lowest level since the first quarter of 2020, before the impact of the COVID-19 pandemic.
The survey covers 2,690 completed office properties and active developments across 54 nodes, totalling roughly 19.3 million m² of gross lettable area. Of the 54 nodes, vacancy improved in 23, deteriorated in 18 and was unchanged in the rest.
For Cape Town landlords and tenants, the headline is reassuring but the detail is more interesting: the metro remains the strongest office market in the country at 6.2% vacancy - now below its pre-pandemic level - with decentralised vacancy steady at 2.7%, while the CBD is the one part of the city where vacancy is rising.
Headline Results
National office vacancy peaked at 16.8% in mid-2022. Four years on, the recovery is still grinding forward: 12.1% is the lowest reading in six years, and the market absorbed around 85,000 m² of space in the quarter, a marked contrast with the negative absorption recorded at the 2022 peak.
Asking rentals continue to respond, with year-on-year growth of 7.4% - up from 6.7% a quarter ago. In inflation-adjusted terms, though, asking rentals across many of the country’s major office nodes remain below their 2019 levels, so the recovery in real income and capital values still has some way to run.
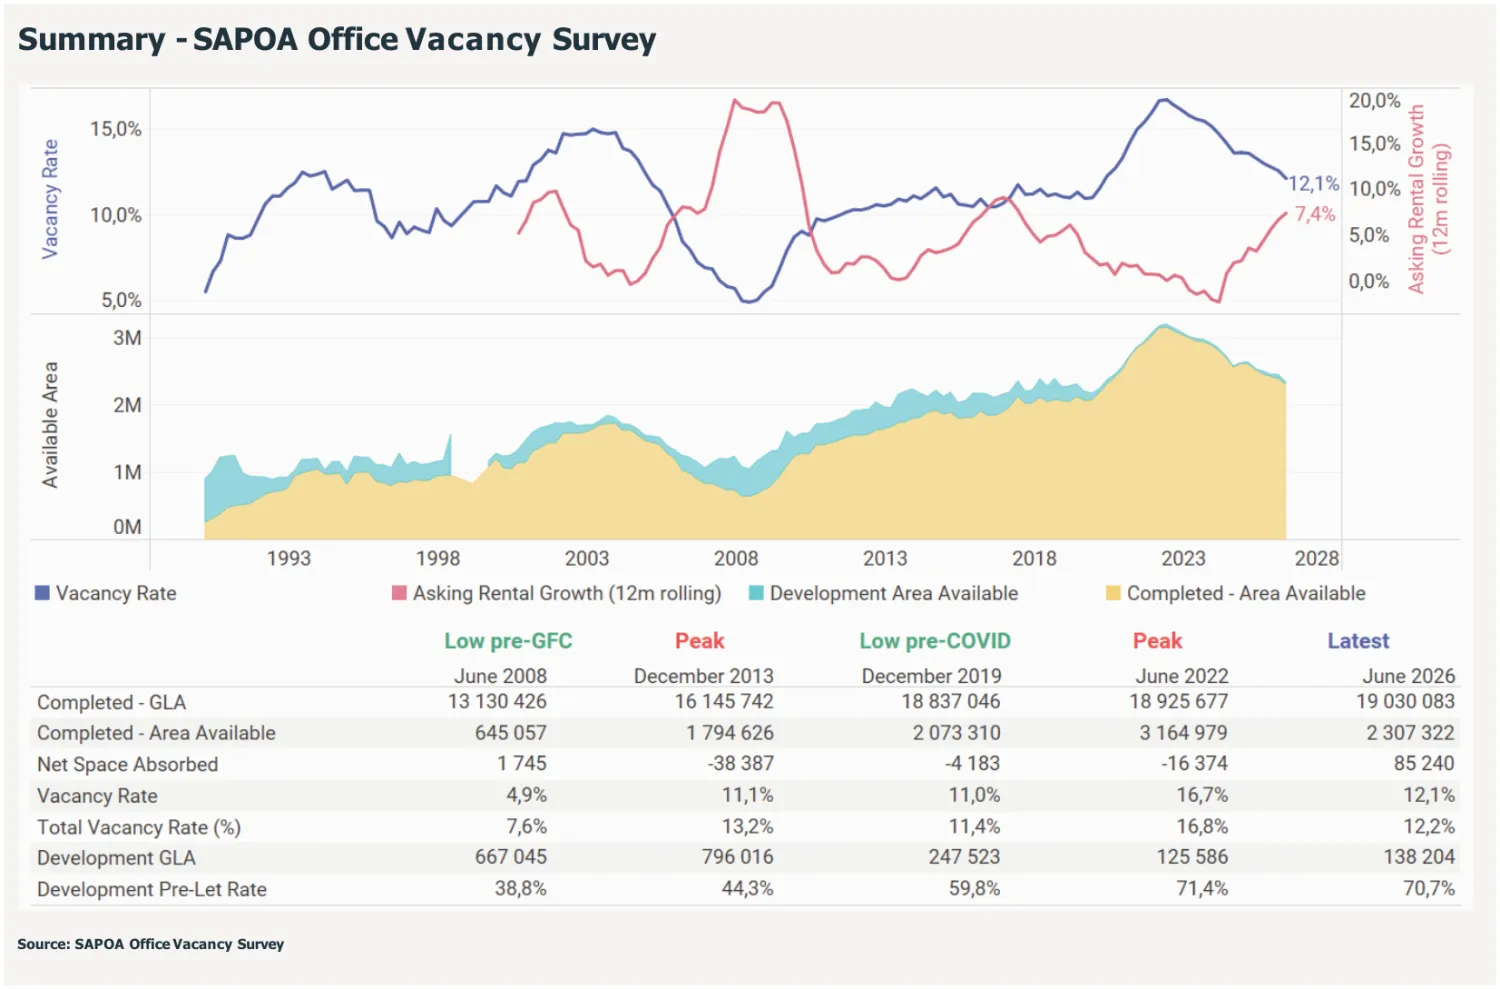
The important nuance is unchanged from last quarter: while the vacancy rate keeps improving, the absolute volume of vacant space - approximately 2.3 million m² nationally - remains well above previous cycles. The market has grown, so the income at risk for landlords has grown with it. We return to this below.
The Recovery Broadens Across Every Grade
The most encouraging shift in this quarter’s survey is that vacancy fell across all four grades, not just at the top. Prime and A-grade stock still enjoy the strongest fundamentals, but B-grade posted the largest quarterly improvement, a sign that demand is finally reaching beyond the best buildings.
| Grade | Q2 2026 Vacancy | Quarter-on-Quarter Shift | Average Asking Rental (R/m²) |
|---|---|---|---|
| Prime | 4.6% | −0.5% | R228 |
| A-Grade | 9.7% | −0.4% | R151 |
| B-Grade | 16.1% | −0.6% | R122 |
| C-Grade | 16.5% | −0.3% | R98 |
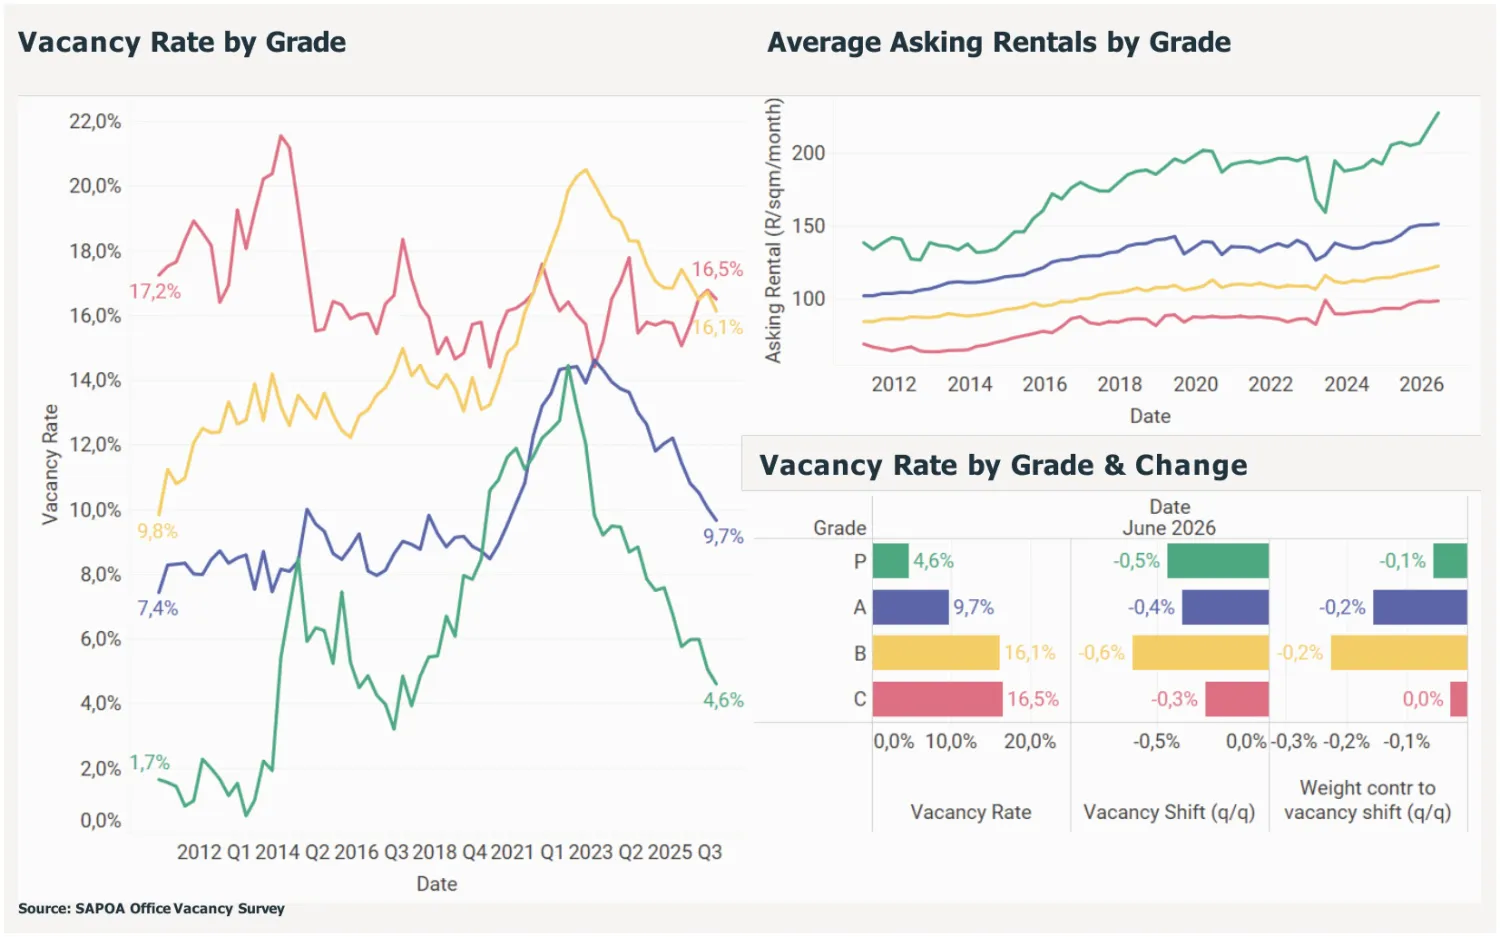
Rental performance mirrors occupancy. Prime offices command an average asking rental of R228/m² per month and have shown the strongest rental growth in recent years, while A-grade rentals have strengthened to R151/m². B- and C-grade rentals, at R122/m² and R98/m², have edged up too, but growth is more muted where vacancy remains elevated.
For occupiers, the gap between Prime and A-grade rentals remains narrow enough that upgrading often makes sense once energy resilience, green credentials and amenities are priced in. For owners of B- and C-grade buildings, a 0.6% improvement is welcome but does not change the structural picture: vacancy in those grades is still above 16%.
Cape Town Leads, Gqeberha and Johannesburg Trail
Regional performance remains uneven. Cape Town Metro is again the strongest-performing office market in the country at 6.2%, and it is now 1.1 percentage points below its pre-pandemic vacancy rate. Durban has also recovered past its 2019 benchmark. Johannesburg and Gqeberha, by contrast, are still carrying vacancy well above pre-pandemic levels.
| Metro | Q2 2026 Vacancy | Q1 2026 | Versus Q4 2019 | Notes |
|---|---|---|---|---|
| Cape Town | 6.2% | 6.0% | −1.1% | Strongest metro; decentralised nodes effectively full |
| Tshwane | 8.5% | 10.1% | +0.3% | Largest quarterly improvement; government tenancy anchors the CBD |
| Durban | 11.9% | 11.7% | −1.9% | Below pre-pandemic level; strong decentralised nodes |
| Johannesburg | 15.1% | 15.5% | +2.6% | Improving from its 2022 peak, but still elevated |
| Gqeberha (Nelson Mandela Bay) | 15.6% | 15.3% | +5.3% | Highest vacancy nationally; recovery lagging |
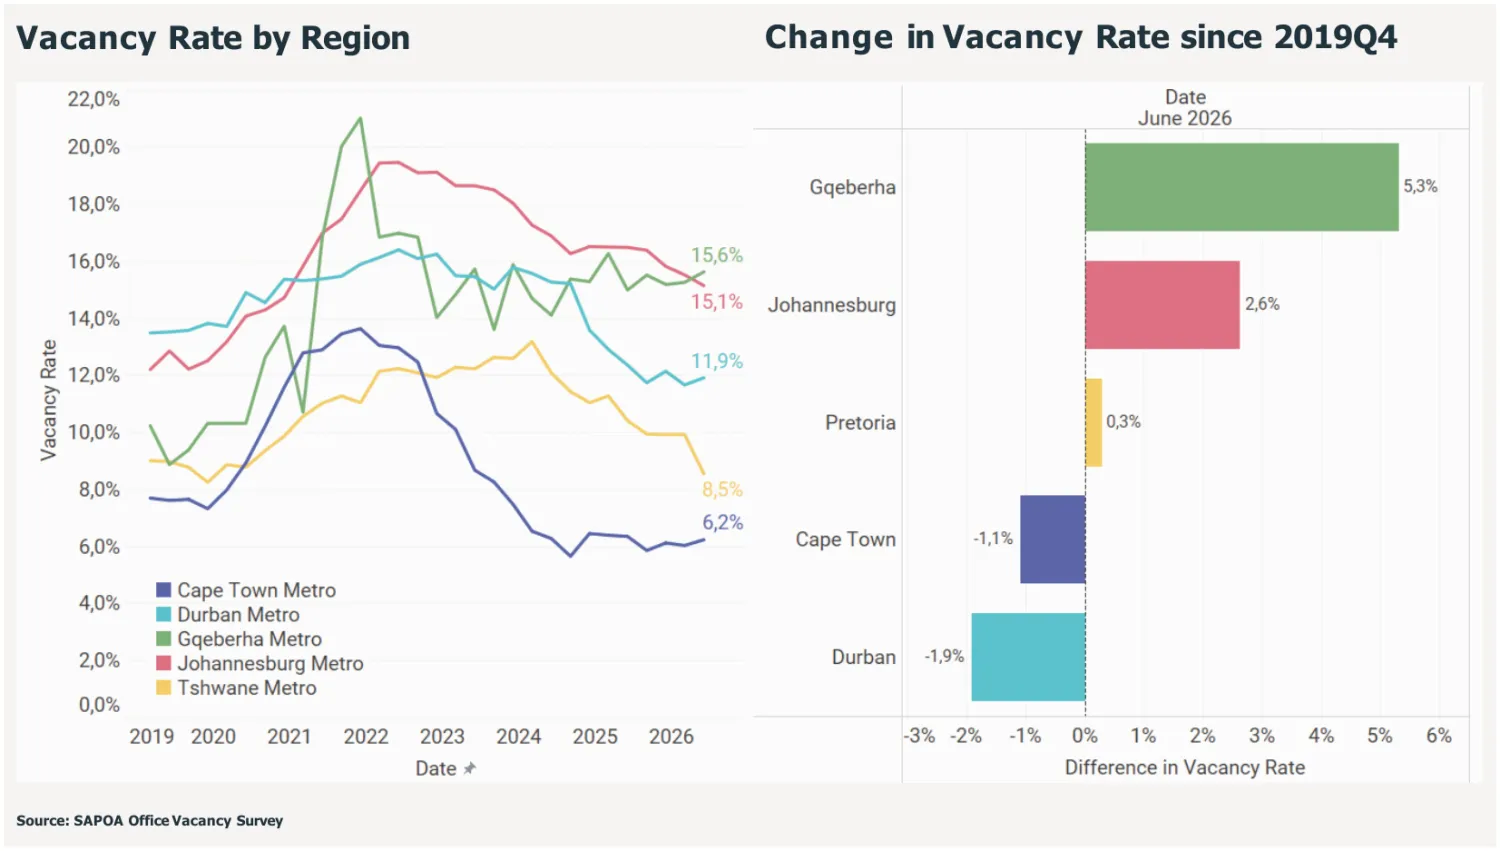
Two things are worth noting for Cape Town readers. First, the metro’s vacancy edged up from 6.0% to 6.2% over the quarter, within the narrow 5.9% to 6.2% band it has held for the past year, and the increase came almost entirely from the CBD rather than the decentralised nodes. Second, Tshwane’s 1.6 percentage point improvement was the sharpest move of any metro this quarter, taking it to within 0.3% of its 2019 level.
Gqeberha, the smallest of the major metros, now records the highest vacancy in the country at 15.6%, and Johannesburg remains 2.6 percentage points above its pre-pandemic benchmark. In both, occupier demand is still insufficient to absorb the older, less competitive stock that dominates the vacant pool.
Decentralised Nodes Continue to Outperform CBDs
Decentralised office nodes remain well ahead of the traditional CBDs: 11.0% vacancy nationally, against 16.0% in the CBDs. Occupiers continue to favour accessible, amenity-rich locations that suit hybrid teams, and the gap has proved remarkably persistent.
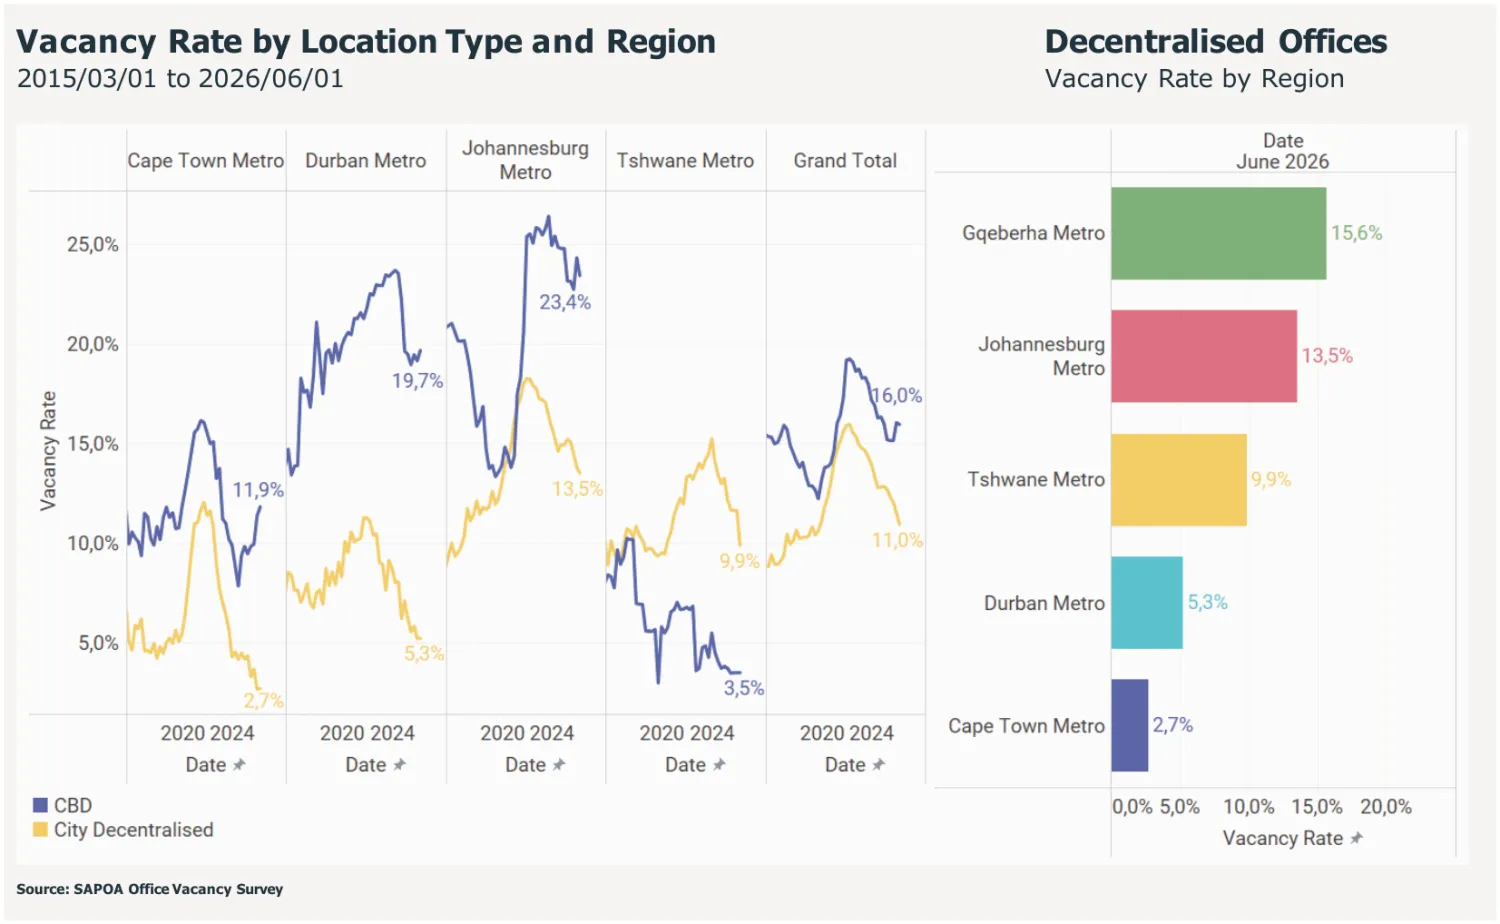
Cape Town’s decentralised vacancy held at 2.7%, unchanged from Q1 and still the lowest of any major market in the country. Durban’s decentralised nodes improved to 5.3% and Tshwane’s to 9.9%, while Johannesburg remains the weakest decentralised market at 13.5%, albeit improving from recent peaks.
Tshwane’s CBD, at 3.5%, remains the exception among the city centres, underpinned by national and provincial government tenants. The report also flags a trend closer to home: while Cape Town’s CBD vacancy is still far below Johannesburg’s and Durban’s, it has been drifting higher in recent years even as the city’s decentralised nodes keep tightening.
A Closer Look at the Cape Town Nodes
The node-level data sharpens the Cape Town picture. Five of the seven nodes are at or below 3.2% vacancy, and every decentralised node except Claremont is under 3%. The CBD is the outlier, and its numbers moved the most this quarter.
Cape Town Office Vacancy by Node - Q2 2026
| Node | Total GLA (m²) | Q2 2026 Vacancy | Q1 2026 Vacancy | Gross Asking Rental (Median, R/m²) |
|---|---|---|---|---|
| V&A Waterfront | 144,572 | 0.9% | 0.4% | R350 |
| Century City | 383,248 | 1.8% | 1.7% | R202 |
| Rondebosch / Newlands | 111,606 | 2.0% | 1.4% | R219 |
| Central (Pinelands & Black River Park) | 369,716 | 2.9% | 3.0% | R195 |
| Bellville | 548,977 | 3.2% | 3.3% | R171 |
| Claremont | 146,910 | 5.5% | 5.5% | R230 |
| CBD Cape Town | 1,060,522 | 11.9% | 11.4% | R151 |
What stands out: the V&A Waterfront remains effectively full at 0.9%, and its median asking rental has stepped up to R350/m² - the highest in the metro by a wide margin, with Prime space in the precinct now asking R380/m². Claremont’s median has climbed to R230/m² and Century City’s to R202/m², both up on the previous quarter. In these nodes a small rise in the vacancy rate reflects a few thousand square metres coming to market, not a change in direction.
The CBD is a different story. Overall vacancy rose from 11.4% to 11.9%, and the detail matters: Prime CBD vacancy actually improved to 4.7%, and B-grade (14.8%) and C-grade (17.8%) were unchanged. The increase came from A-grade, which moved from 5.8% to 7.4% - roughly 27,000 m² of A-grade CBD space is now on the market at a median asking rental of R216/m². For tenants that is the most A-grade choice the CBD has offered in the past year; for landlords it means A-grade CBD stock is competing harder than it was a quarter ago.
The development pipeline tells its own story about confidence in the city. Of the 138,204 m² of office space under construction nationally, roughly 64,000 m² - close to half - is in Cape Town: 45,000 m² in the Central node (Pinelands and Black River Park) at an asking rental of R340/m², 10,500 m² in the CBD at R295/m², and 8,500 m² in Century City at R285/m². Almost all of it is already spoken for: only around 10,000 m² of that new space is still available to let.
Development Pipeline Remains Thin, but Pre-Lets Are Strong
Nationally, office development activity is running at just 0.7% of existing stock, with 138,204 m² under construction against a long-term average of roughly 490,000 m². The pipeline is constrained, with few new starts and activity well below previous development cycles.
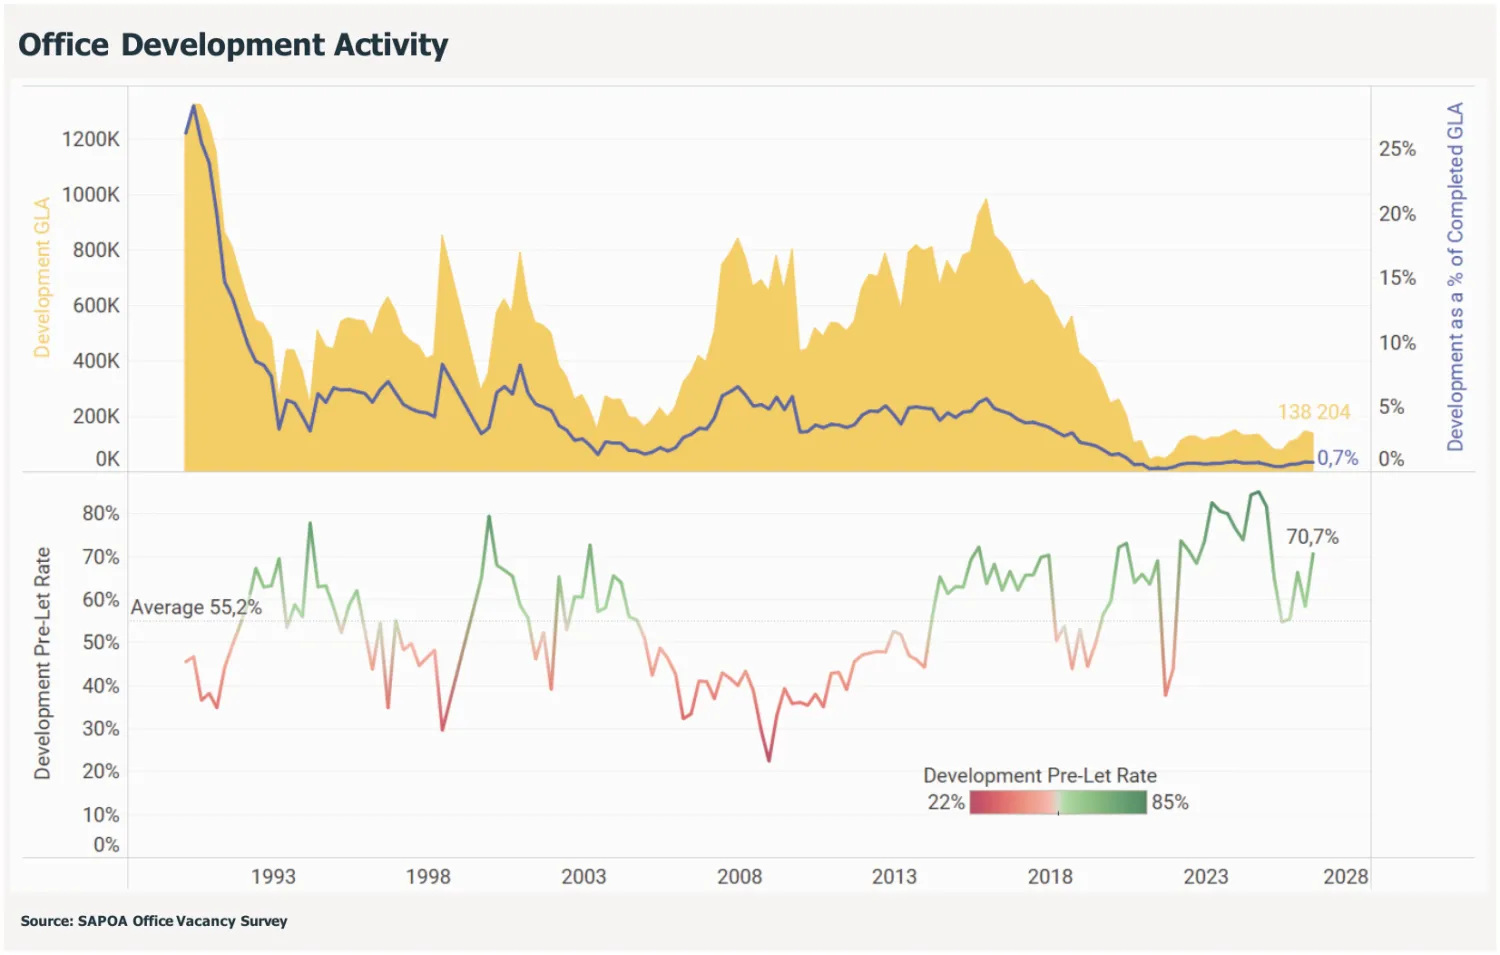
What is under construction is overwhelmingly tenant-driven. The pre-let rate rose to 70.7% this quarter, far above the long-term average of 55.2%. Speculative supply is close to non-existent, which means the tightening in Prime and A-grade vacancy is unlikely to be undone by a wave of competing new buildings. For owners of well-located, well-specified stock, that is the most supportive supply backdrop in years.
Distressed Mid-Quality Stock Remains the Drag
Roughly half of all A-, B- and C-grade office stock is fully let. The difference lies in the other half. A-grade buildings that do have vacancy tend to sit in the lower brackets, while B- and especially C-grade stock account for a disproportionate share of buildings that are more than 30% - and in many cases more than 50% - empty.
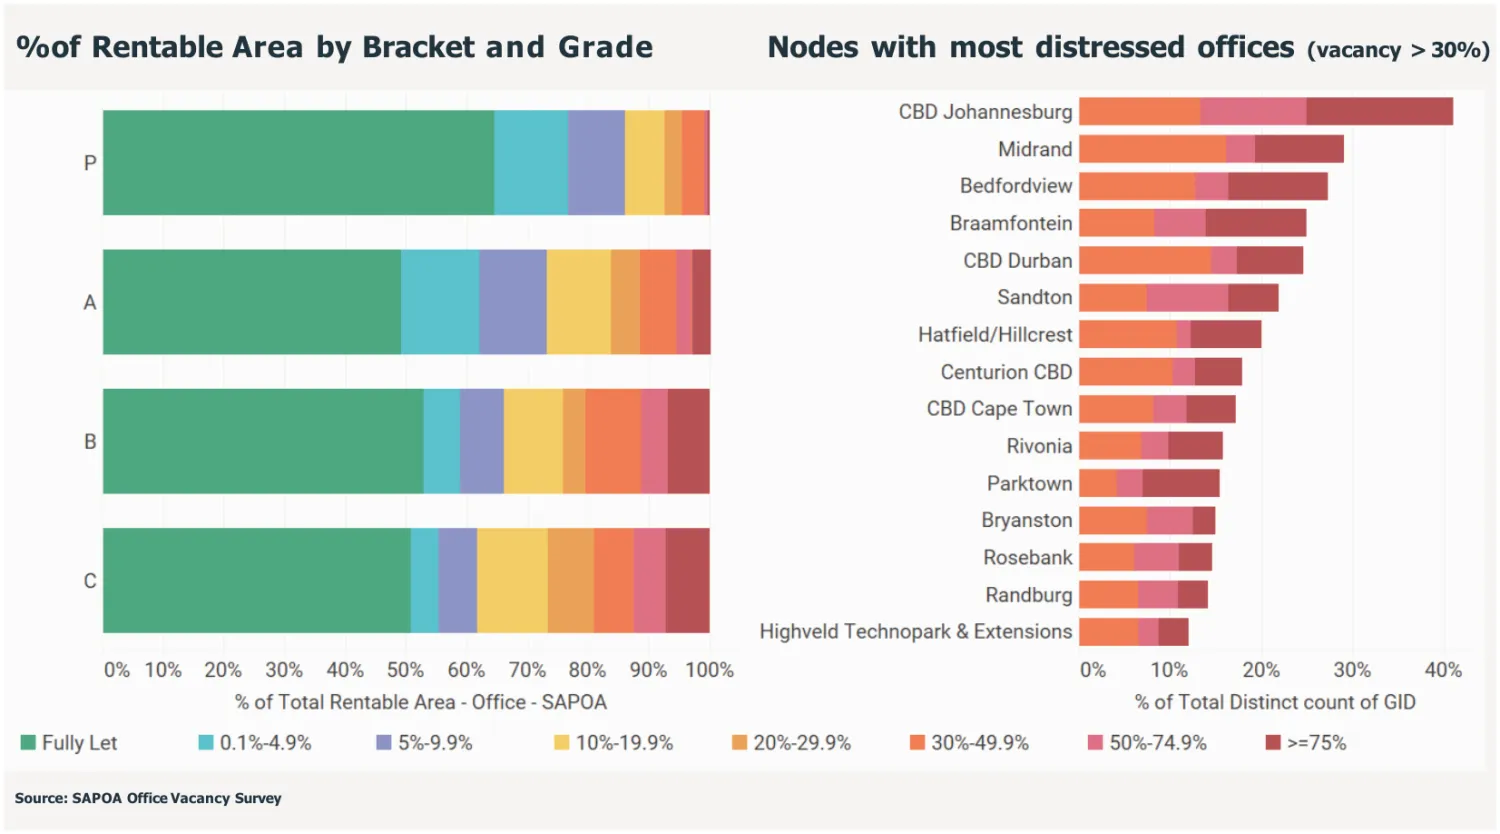
These buildings are hard to fix. Physical constraints limit their appeal to modern occupiers, and valuations, refurbishment costs and redevelopment feasibility limit what owners can do about it. The result is downward pressure on rentals in the affected nodes, as landlords lean on discounted rents and incentives to fill space.
Johannesburg CBD has the largest count of distressed office buildings nationally, followed by Midrand and Bedfordview. CBD Cape Town still features on the list, sitting mid-table with a cluster of older buildings in the greater-than-30% vacancy bracket. Whether that stock is repositioned, sold into alternative uses or left to weigh on CBD asking rentals is the question to watch in the second half of the year.
Vacancy Rates Down, but Surplus Space Remains
A vacancy rate is a useful barometer, but it can obscure the sheer volume of space in the system. The office market has grown substantially over the past two decades, so a rate that looks comparable to a previous cycle can represent far more unoccupied floor space.
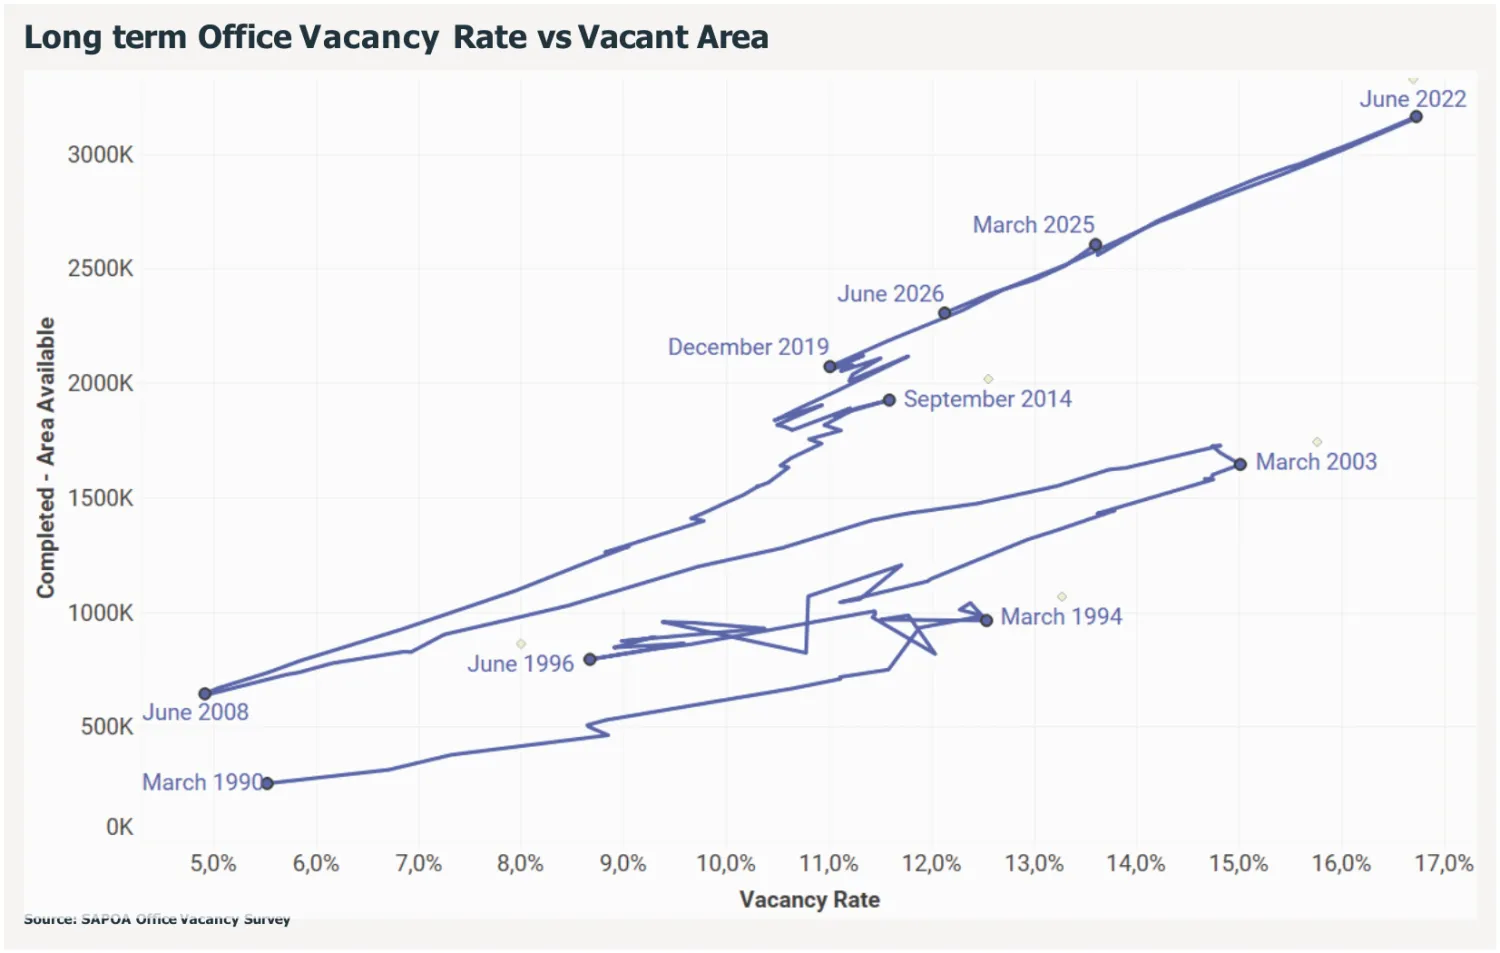
That is the position today. Vacancy has improved from 16.8% at the 2022 peak, but around 2.3 million m² of office space remains available. When the 2003 cycle peaked at 15.0%, total vacant space was more than 650,000 m² lower. The absorption task in this cycle is bigger than in any previous downturn, even as the headline rate keeps improving.
The report’s conclusion is one we share: the oversupply creates opportunity for proactive owners. Occupiers are still reassessing their requirements, and buildings that offer flexibility, operational efficiency, sustainability credentials or targeted upgrades will keep capturing that demand ahead of the pack.
Micro-Location Still Decides Outcomes
The Q2 survey uses Sandton as its case study for how much performance varies within a single node. Sandton’s overall vacancy conceals sub-precincts with vacancy as low as 5.3% (Rivonia) and 7.7% (Alice Lane, south of West Street) alongside pockets at 25.5% (the Sandton City precinct) and 35.3% (Sandown Valley). A tenant or investor working off the node average would get every one of those decisions wrong.
The same logic applies in Cape Town, and this quarter’s CBD data proves the point. A headline of 11.9% hides Prime buildings at 4.7% and a block of older C-grade stock at 17.8%. Within Century City, newer buildings on Bridgeways and Park Lane let quickly while older periphery stock takes longer; in the CBD, Waterfront-adjacent A-grade stock behaves nothing like the older Foreshore and Loop Street buildings. Building-level intelligence, not node averages, is what a leasing, acquisition or asset-management decision should rest on.
What This Means for Cape Town Landlords and Tenants
For landlords
- • Premium decentralised Cape Town stock remains the strongest position in the country. With the Waterfront at 0.9%, Century City at 1.8%, Newlands at 2.0% and Bellville at 3.2%, reletting risk is minimal. The focus should be on renewing anchor tenants early and locking in escalations.
- • Asking rentals are moving. The Waterfront’s median has stepped up to R350/m², Claremont’s to R230/m² and Century City’s to R202/m². Owners who have held rentals flat since the pandemic have room to reprice at renewal.
- • A-grade CBD owners face a more competitive quarter. With A-grade CBD vacancy at 7.4%, specification, energy resilience and fit-out contributions will decide which buildings let first. B- and C-grade owners with deep vacancy still need to make a clear-eyed call: reposition meaningfully, change use, or accept a discounted rental.
For tenants
- • In the decentralised nodes, plan 12 to 18 months ahead of any lease event. Vacancy below 3% means options are limited and landlords hold the pricing power, particularly in the Waterfront, Century City, Newlands and Pinelands.
- • The CBD offers real value right now. A-grade CBD space at a median of R216/m² is a fraction of Waterfront pricing at R350/m², and there is more A-grade choice in the city centre than at any point in the past year.
- • New-build options exist but are scarce. Around 64,000 m² is under construction in Cape Town across Central, the CBD and Century City, at asking rentals of R285 to R340/m², but only around 10,000 m² of it is still available. Tenants who want new space should engage early.
Key Takeaways
- • National office vacancy improved to 12.1% in Q2 2026 - the lowest level since the first quarter of 2020, and down from 12.6% in Q1.
- • Vacancy fell across every grade: Prime 4.6%, A-grade 9.7%, B-grade 16.1% and C-grade 16.5%, with B-grade posting the largest quarterly improvement.
- • Cape Town remains the strongest metro at 6.2%, now 1.1 percentage points below its pre-pandemic vacancy rate, with decentralised vacancy steady at 2.7%.
- • The V&A Waterfront is effectively full at 0.9% and its median asking rental has climbed to R350/m².
- • CBD Cape Town vacancy rose to 11.9% as A-grade vacancy moved from 5.8% to 7.4% - more A-grade choice for tenants, more competition for landlords.
- • Close to half of all office space under construction nationally (about 64,000 m² of 138,204 m²) is in Cape Town, and most of it is already pre-let.
- • The national pre-let rate has climbed to 70.7%, limiting speculative supply risk in the better-located segments.
- • Around 2.3 million m² of office space is still available nationally, and distress remains concentrated in B- and C-grade buildings in CBD Johannesburg, Midrand and Bedfordview.
Need Cape Town Office Market Intelligence?
Headline numbers only get you so far. Whether you’re re-leasing a portfolio, hunting for the right space, or evaluating an acquisition in the Cape Town office market, Baker Street Properties brings building-level, node-level and tenant-level intelligence to every conversation.
Source: SAPOA / MSCI / Gmaven Office Vacancy Survey, Q2 2026.
Get in Touch