
South Africa’s office recovery has kept its momentum. According to the SAPOA Office Vacancy Survey, the national vacancy rate improved to 11.8% in Q3 2026 - down from 12.2% in the second quarter, five percentage points below the mid-2022 peak and the lowest level in more than six years.
The survey covers 2,691 completed office properties and active developments across 54 nodes, totalling almost 19.5 million m² of gross lettable area. Of the 54 nodes, vacancy improved in 23, deteriorated in 21 and was unchanged in the rest.
For Cape Town the picture has two halves. The metro is still the tightest office market in the country at 6.9%, and its decentralised nodes are effectively full at 2.7%. But CBD vacancy has climbed to 14.0%, and this quarter’s report maps exactly where in the CBD that space is sitting.
Headline Results
National office vacancy peaked at 16.8% in mid-2022. The recovery since then has been steady, and this quarter it was supported by positive net absorption of almost 70,000 m² (69,502 m²), while the amount of completed space available fell again, to about 2.25 million m².
Asking rentals are still rising, with year-on-year growth of 7.2% - a little softer than last quarter’s 7.4% and easing from recent highs, but still relatively firm. At the same time, the development pipeline is small and increasingly tenant-led, with 70.4% of space under construction already pre-let.
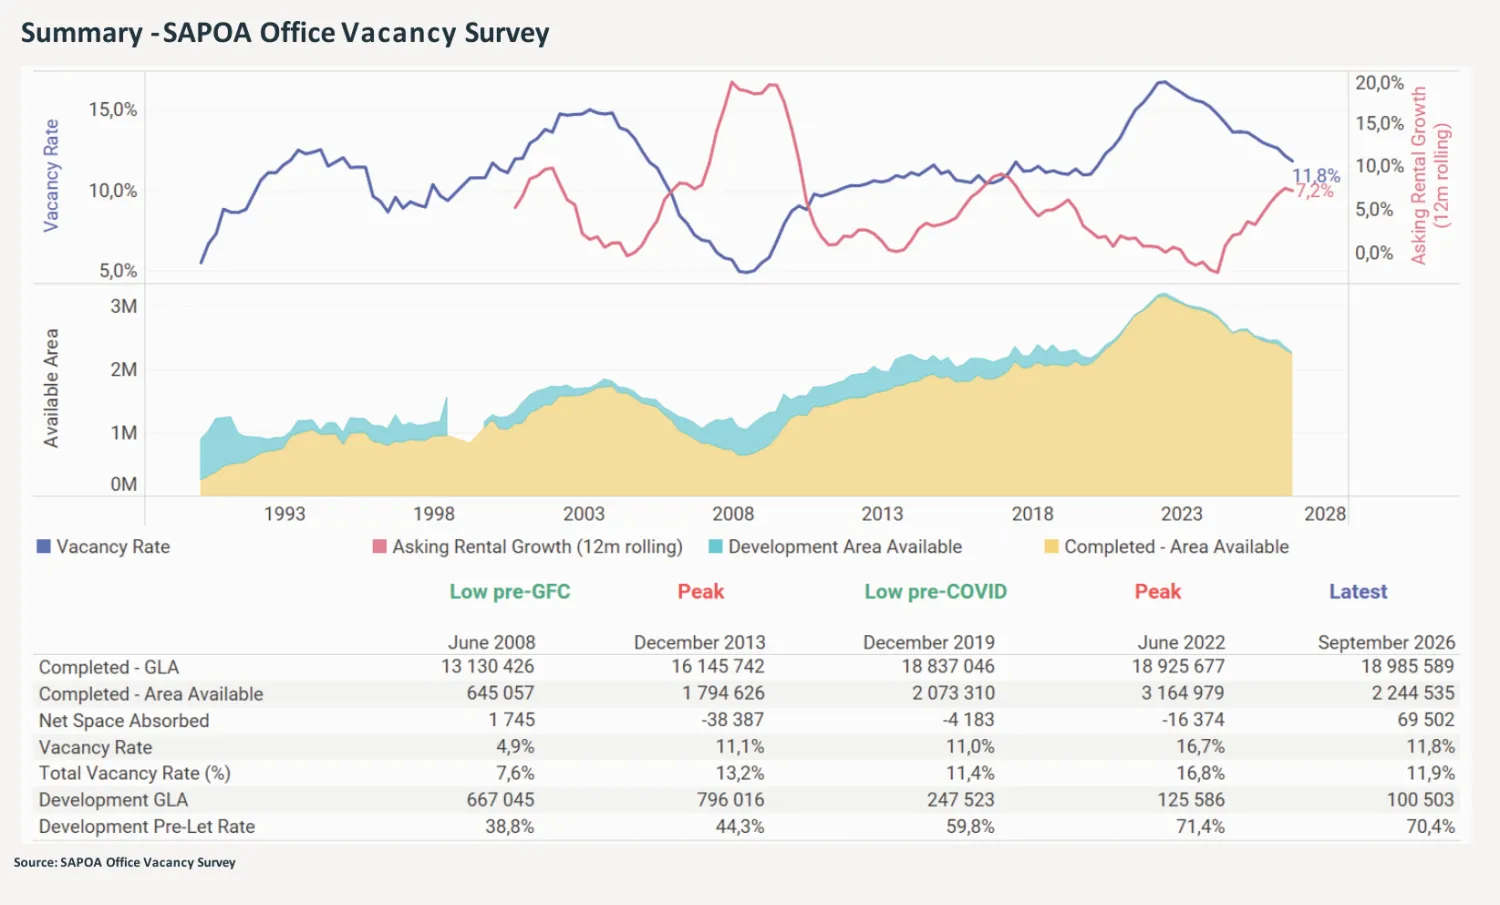
Taken together - improving occupancy, positive absorption and very little speculative development - the report sees a progressively tighter office market. It also stresses that conditions still vary considerably from node to node and grade to grade, and that is where the useful detail in this quarter’s survey lies.
The Recovery Reaches C-Grade Offices
The improvement is no longer confined to the best buildings. A-, B- and C-grade vacancy all fell this quarter, and the strongest move came from C-grade, which dropped 80 basis points to 15.6% - now marginally below B-grade. Prime edged up to 4.7%, but that is still exceptionally low against both the other grades and Prime’s own history.
| Grade | Q3 2026 Vacancy | Quarter-on-Quarter Shift | Average Asking Rental (R/m²) |
|---|---|---|---|
| Prime | 4.7% | +0.1% | R234 |
| A-Grade | 9.5% | −0.2% | R149 |
| B-Grade | 15.9% | −0.4% | R123 |
| C-Grade | 15.6% | −0.8% | R101 |
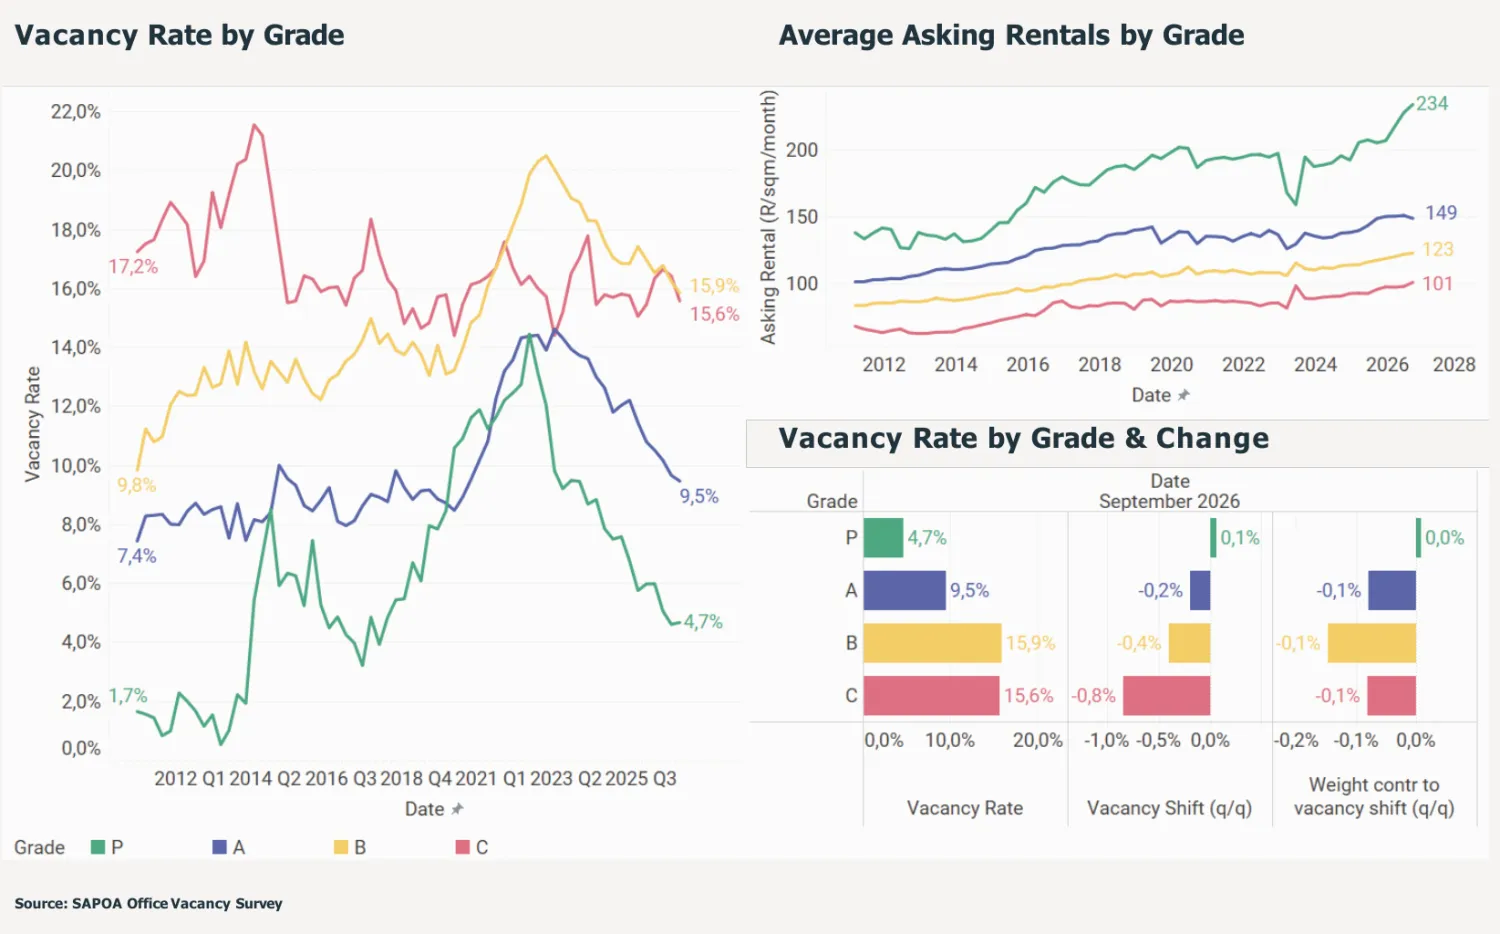
Rentals tell the same story. Prime asking rentals reached R234/m² per month, extending a strong run of growth and widening the premium over every other grade. A-grade averaged R149/m², a touch below last quarter’s R151/m², while B- and C-grade rentals rose to R123/m² and R101/m². Over the longer run the trend is upward in all four grades, with better occupancy now supporting rentals beyond the Prime segment.
The report adds an important caveat about the secondary-grade improvement: some of it may reflect older or less competitive offices being converted to residential and other uses, which removes surplus space as well as reflecting tenant demand. For owners of B- and C-grade buildings, that is a reminder that the market is rebalancing partly by taking stock out, and the gap between Prime and secondary space is still wide.
Durban and Tshwane Join Cape Town Below 10%
Single-digit vacancy is no longer a Cape Town story. Cape Town is still the tightest major market at 6.9%, but Tshwane (8.9%) and Durban (9.3%) are now below 10% as well. At the other end, Gqeberha (15.7%) and Johannesburg (14.7%) remain well above, a spread of almost nine percentage points between the tightest and weakest metros.
| Metro | Q3 2026 Vacancy | Q2 2026 | Change Since Q1 2022 | Notes |
|---|---|---|---|---|
| Cape Town | 6.9% | 6.5% | −6.1% | Still the tightest metro; the quarter’s rise came from the CBD |
| Tshwane | 8.9% | 8.5% | −3.2% | Below 10%; government tenancy anchors the CBD |
| Durban | 9.3% | 11.9% | −6.8% | Largest improvement this quarter and since 2022 |
| Johannesburg | 14.7% | 15.1% | −4.8% | Improving, but availability is still substantial |
| Gqeberha (Nelson Mandela Bay) | 15.7% | 15.6% | −1.2% | Highest vacancy nationally; lagging the recovery |
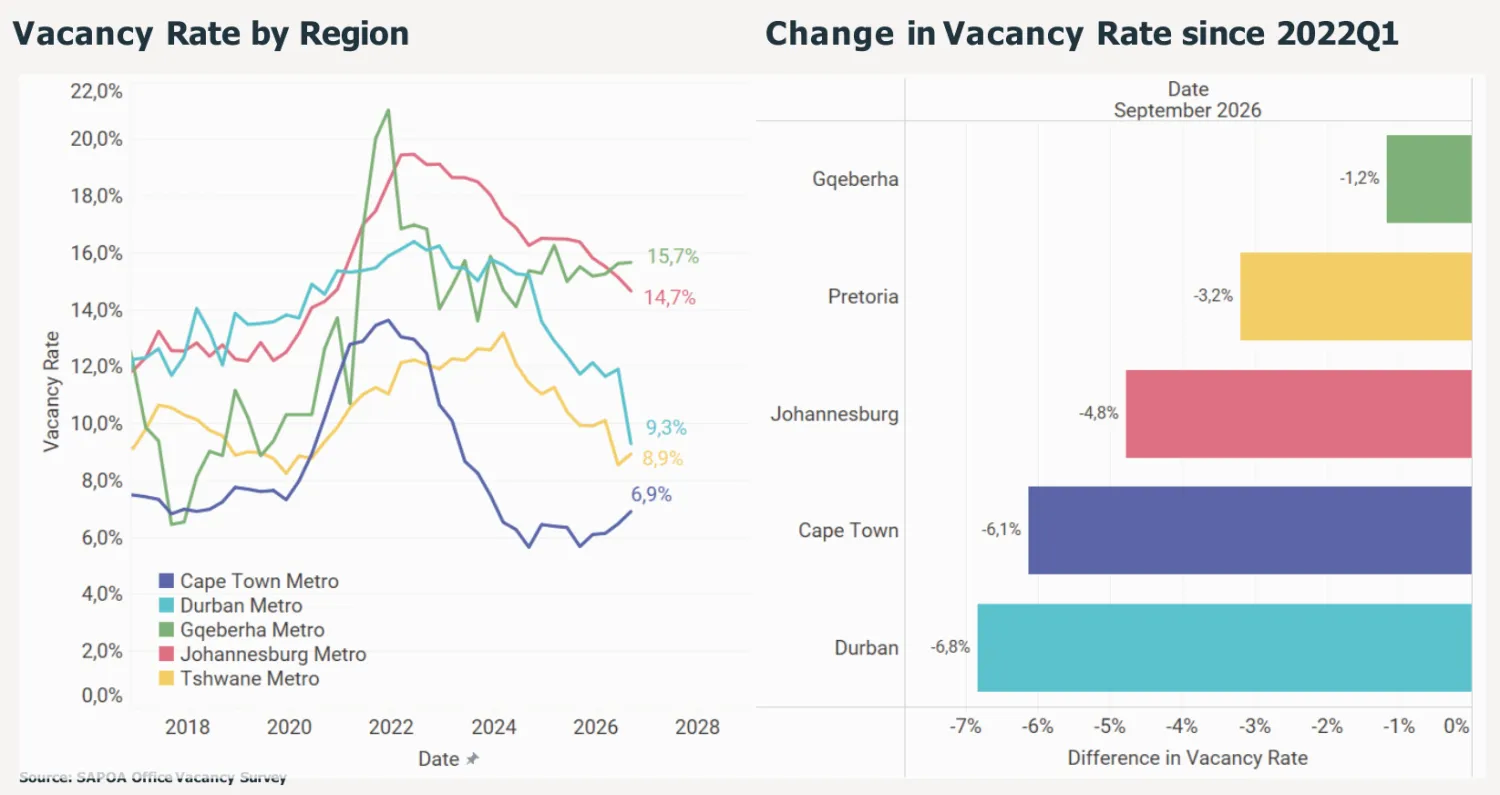
The scale of the recovery since early 2022 has differed sharply between metros. Durban has improved the most, by 6.8 percentage points, and it was also this quarter’s standout, dropping from 11.9% to 9.3%. Cape Town is close behind at 6.1 points, Johannesburg has improved by 4.8 points and Tshwane by 3.2, while Gqeberha has moved only 1.2 points and remains above 15%.
For Cape Town readers, the quarter needs some unpacking. Metro vacancy rose from 6.5% to 6.9%, but the decentralised nodes held steady at 2.7% - all of the increase came from the CBD, which we look at closely below. (SAPOA has also revised its earlier quarters since the Q2 report, so the June figures in this edition differ slightly from those we published last quarter.)
Decentralised Nodes Keep Their Advantage
The gap between the CBDs and decentralised markets remains pronounced: 11.0% vacancy in decentralised nodes nationally against 16.1% in the CBDs. Occupiers continue to favour accessible locations outside the traditional city centres, but the aggregate hides big differences between metros.
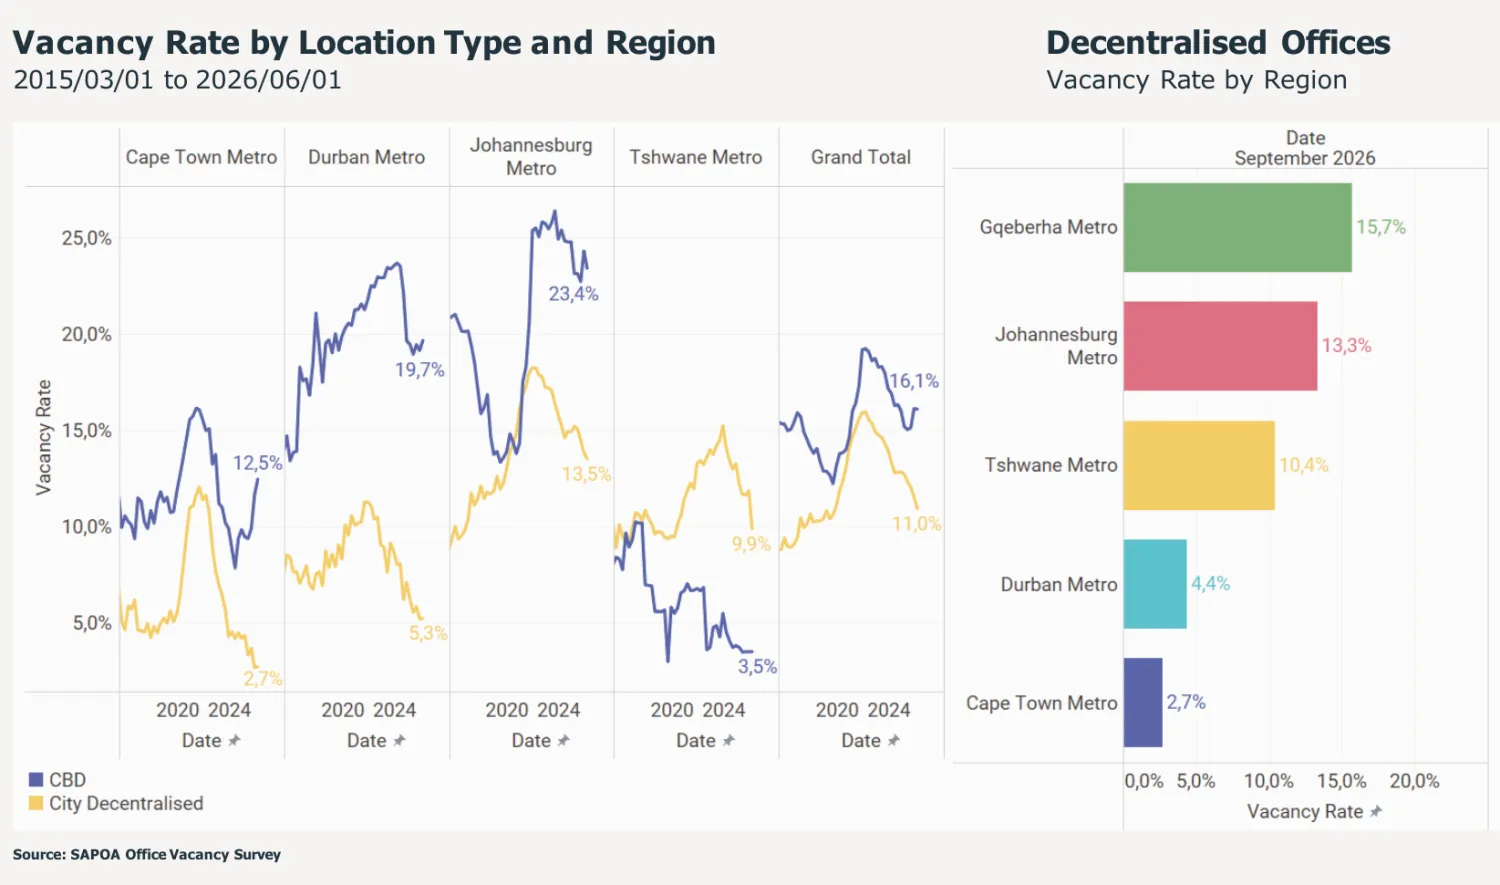
Tshwane is the outlier, with a CBD at just 3.5% - lower than its own decentralised nodes - because government-related demand underpins city-centre occupancy. Johannesburg faces the biggest CBD challenge, and Durban shows the widest relative gap between a weak CBD and very tight decentralised nodes. By September, decentralised vacancy stood at 2.7% in Cape Town, 4.4% in Durban, 10.4% in Tshwane, 13.3% in Johannesburg and 15.7% in Gqeberha.
Cape Town shows the opposite pattern to Tshwane: decentralised vacancy is exceptionally low, while the CBD has been rising. The report’s location-type comparison runs to June, when Cape Town’s CBD stood at 12.5%; the September node table puts it at 14.0%. The widening gap is the clearest signal in the city’s numbers this quarter - demand continues to favour the decentralised nodes despite tight conditions across the metro as a whole.
A Closer Look at the Cape Town Nodes
At node level, six of Cape Town’s seven office nodes are at or below 5.3% vacancy, and five are at or below 3.1%. The CBD is the exception, and it moved the most again this quarter.
Cape Town Office Vacancy by Node - Q3 2026
| Node | Total GLA (m²) | Q3 2026 Vacancy | Q2 2026 Vacancy | Gross Asking Rental (Median, R/m²) |
|---|---|---|---|---|
| Rondebosch / Newlands | 111,606 | 0.7% | 2.0% | R219 |
| V&A Waterfront | 144,572 | 0.8% | 0.9% | R420 |
| Century City | 391,139 | 2.0% | 1.8% | R202 |
| Bellville | 548,977 | 3.1% | 3.2% | R168 |
| Central (Pinelands & Black River Park) | 399,716 | 3.1% | 2.9% | R189 |
| Claremont | 146,910 | 5.3% | 5.5% | R231 |
| CBD Cape Town | 1,046,414 | 14.0% | 12.5% | R165 |
What stands out: Rondebosch / Newlands is now the tightest node in the city at 0.7%, with only 726 m² available, and the V&A Waterfront is effectively full at 0.8%. The only space on offer at the Waterfront is Prime, now asking R420/m² - up from R380/m² last quarter and by far the highest rental in the metro. Bellville, Claremont, Rondebosch / Newlands and the Waterfront all improved, and the small rises in Century City and Central are modest in absolute terms.
The CBD is a different story. It holds 37.5% of Cape Town’s office space but 146,102 m² of the city’s 192,862 m² available - about 76%. A-grade is again the driver: A-grade CBD vacancy has gone from 2.2% in December 2025 to 5.8%, 7.4% and now 10.7%, leaving 38,704 m² of A-grade space on the market at a median asking rental of R212/m². B-grade (16.9%) and C-grade (17.1%) CBD vacancy also crept up this quarter.
Adding up the node table by grade, Cape Town’s Prime vacancy is 2.2%, A-grade 4.2%, B-grade 12.6% and C-grade 16.4%. Prime, A- and B-grade are all below the national figures; C-grade, 84% of which is in the CBD, is slightly above.
Inside the Cape Town CBD: Precinct by Precinct
This quarter’s report uses the Cape Town CBD as its case study in micro-markets, and it is the most useful page in the survey for anyone leasing or owning in the city centre. Vacancy across the CBD’s precincts ranges from 7.6% to almost 20% - a wide spread for such a compact area, reflecting how much the age and quality of the buildings differ from one part of town to the next.
| CBD Precinct | Vacancy | Rentable Area (m²) | Vacant Area (m²) |
|---|---|---|---|
| Between Wale and Strand | 19.9% | 178,934 | 35,600 |
| Between Wale and Hans Strijdom | 16.9% | 346,761 | 58,700 |
| Hans Strijdom, east to the N1 and Christiaan Barnard | 11.0% | 360,498 | 39,700 |
| West of Wale and the periphery | 7.6% | 160,221 | 12,100 |
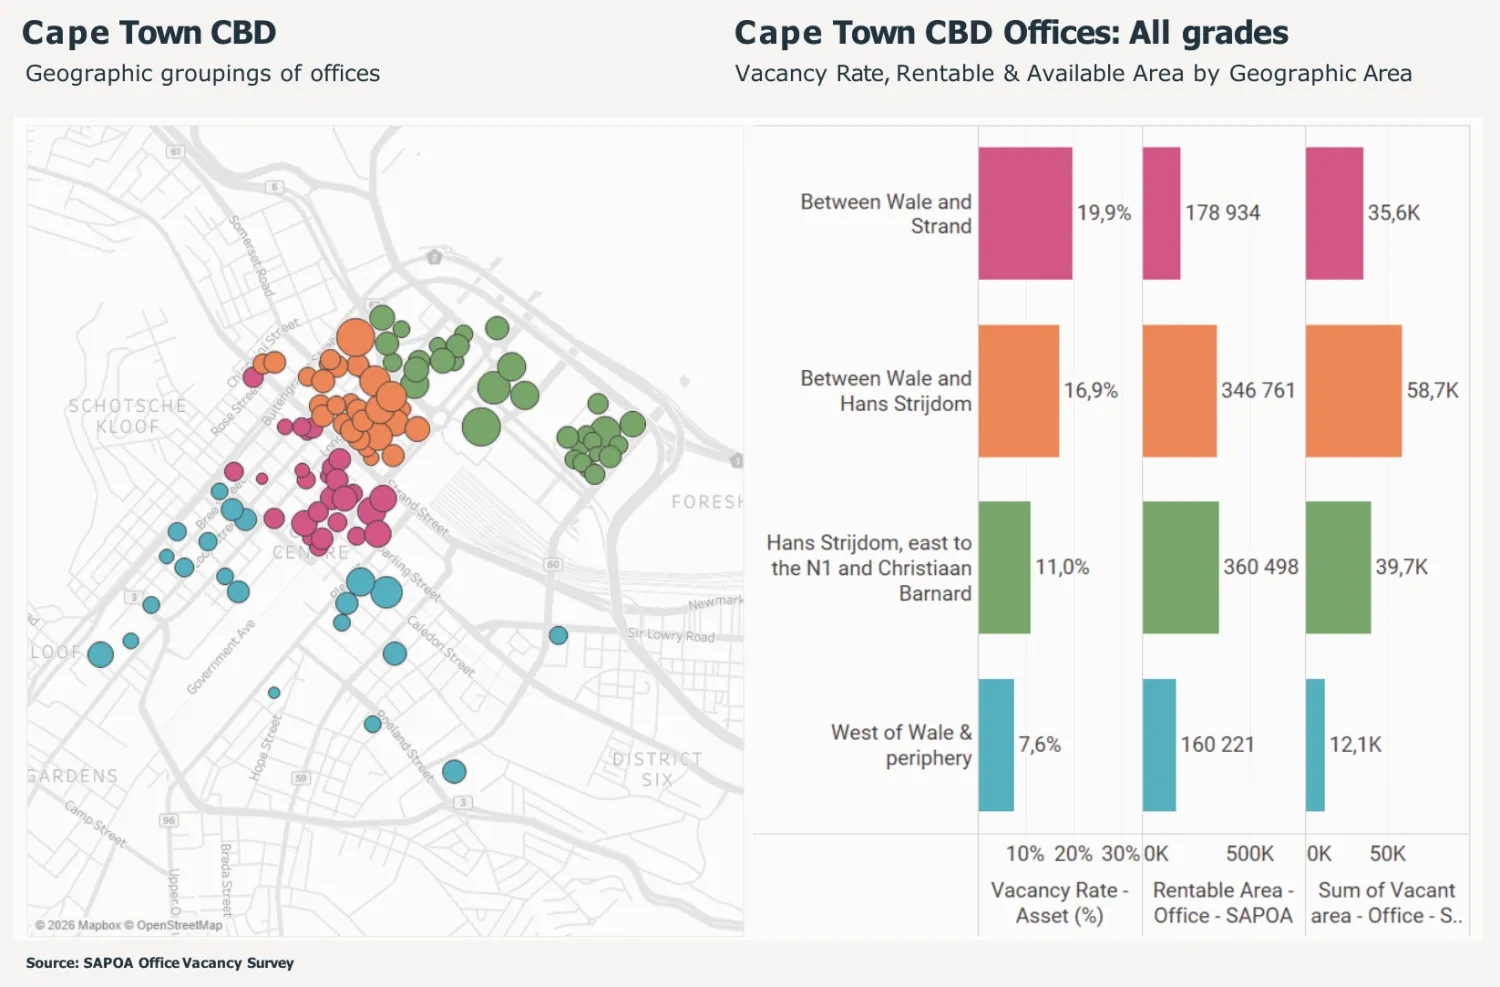
The area between Wale and Strand Streets has the highest vacancy at 19.9%, about 35,600 m². The larger precinct between Wale and Hans Strijdom has a lower rate of 16.9% but, because it holds far more stock, the largest volume of vacant space at about 58,700 m². Between them, these two precincts hold roughly two-thirds of everything vacant in the CBD. East of Hans Strijdom, towards the N1 and Christiaan Barnard, vacancy is 11.0%, while the western side of Wale Street and the periphery perform considerably better at 7.6%.
The lesson is the one the report draws: a single CBD figure of 14.0% hides very different leasing conditions a few blocks apart. Building age, quality and specification shape performance alongside location, particularly as occupiers favour modern, efficient space. For a tenant that means real choice and negotiating room in the older core; for an owner it means the right comparison is the precinct and the building, not the CBD average.
Development Pipeline at Its Thinnest, Still Tenant-Led
Nationally, office space under construction has fallen to about 100,500 m² (100,503 m²), equivalent to just 0.5% of completed stock - close to the lowest level in the survey’s history and down from 138,204 m² last quarter. Despite better vacancy and rental growth, developers remain cautious, and the market is still focused on absorbing and repositioning the space it already has.
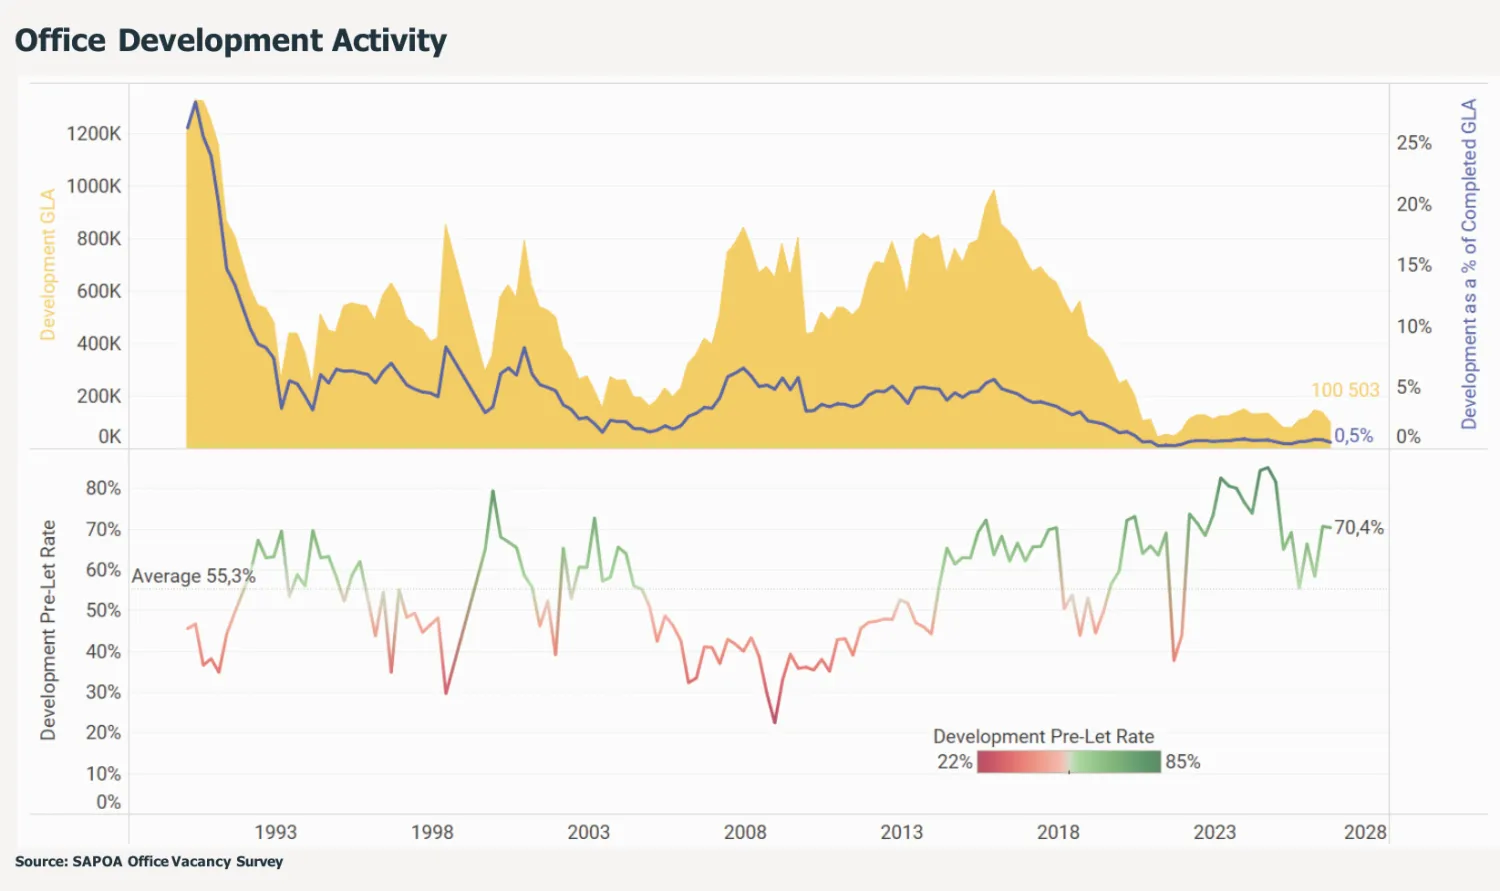
What is being built is overwhelmingly tenant-led. The pre-let rate is 70.4%, comfortably above the long-term average of 55.3%, although below the particularly high rates of recent years. Only 29,750 m² of the space under construction nationally is still available to let, so speculative supply is unlikely to add materially to future vacancy.
Cape Town accounts for 34,000 m², about a third of the national pipeline: 15,000 m² in the Central node (Pinelands and Black River Park) at an asking rental of R340/m², 10,500 m² in the CBD at R295/m² and 8,500 m² in Century City at R285/m². Central’s pipeline has shrunk from 45,000 m² last quarter as its Prime stock grew from 60,000 m² to 90,000 m² - and that Prime space is fully let, with 0.0% vacancy. Of the 10,500 m² under construction in the CBD, 9,177 m² is still available.
Distress Concentrates in Specific Assets and Nodes
Around half of all A-, B- and C-grade stock is fully let. The difference lies in the rest: A-grade buildings with vacancy tend to sit in the lower brackets, while B- and C-grade buildings account for more of the stock at elevated vacancy levels. Distress remains concentrated in lower-grade assets even as overall fundamentals improve.
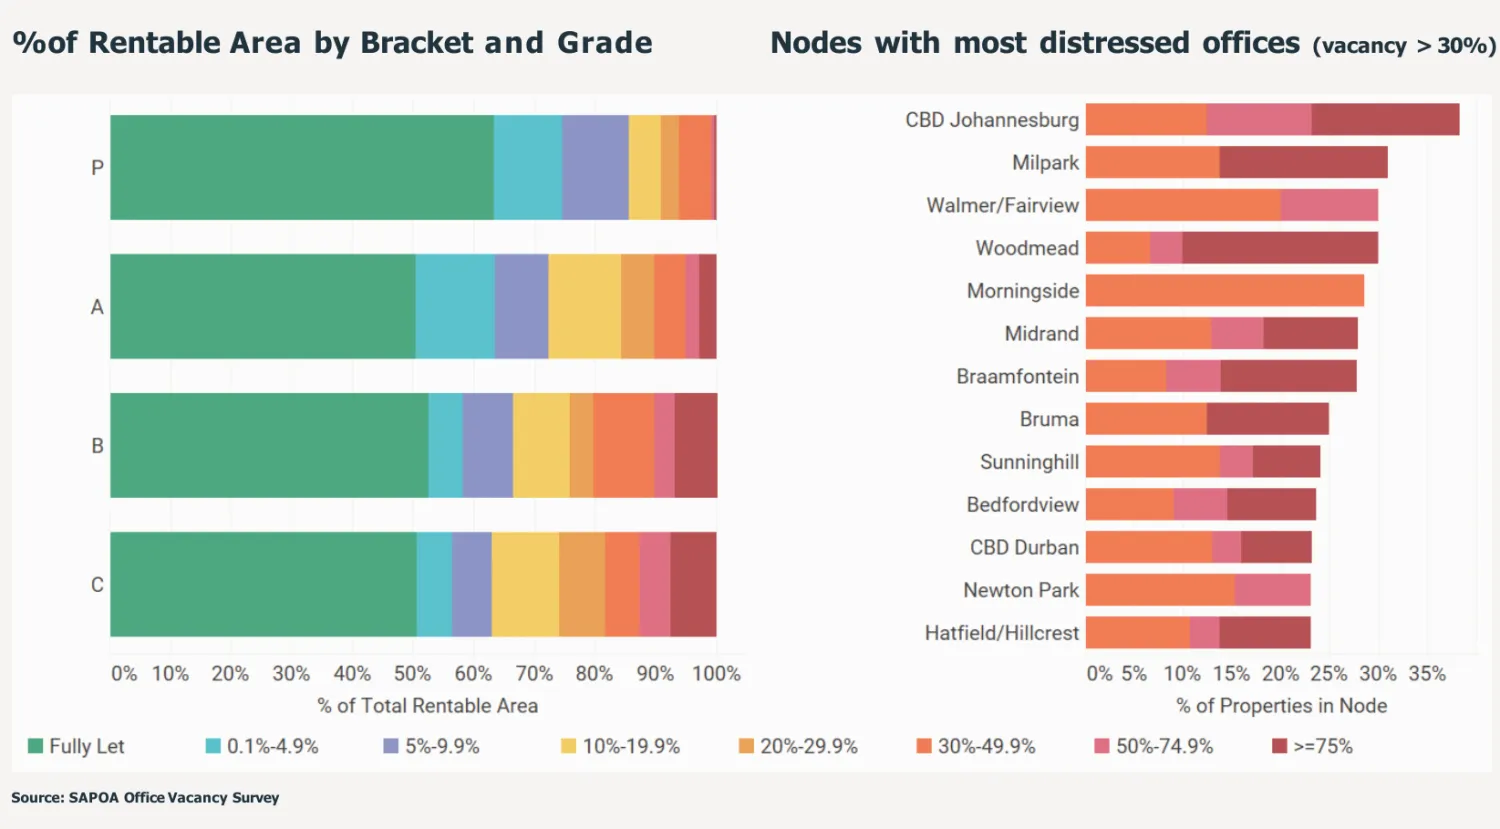
These buildings face real barriers. Physical limitations reduce their appeal to modern occupiers, and valuations, refurbishment costs and redevelopment feasibility constrain what owners can do. Weaker properties are therefore likely to keep pressure on rentals in the affected nodes, with landlords relying on competitive rents, incentives or alternative uses.
Highly vacant buildings are also clustered geographically. Johannesburg CBD has the largest proportion of distressed offices, with more than a third of its buildings above 30% vacancy, followed by Milpark and Walmer/Fairview, and several other Johannesburg nodes feature prominently. CBD Cape Town, which appeared on last quarter’s list, is not among the 13 nodes shown this quarter, which suggests its rising vacancy is spread across many buildings rather than concentrated in a few near-empty ones.
Surplus Space Has Fallen Sharply, but Remains Large
A vacancy rate is a useful barometer, but the volume of vacant space matters too. The office market is much larger than in previous cycles, so a vacancy rate that looks familiar can represent far more empty floor space.
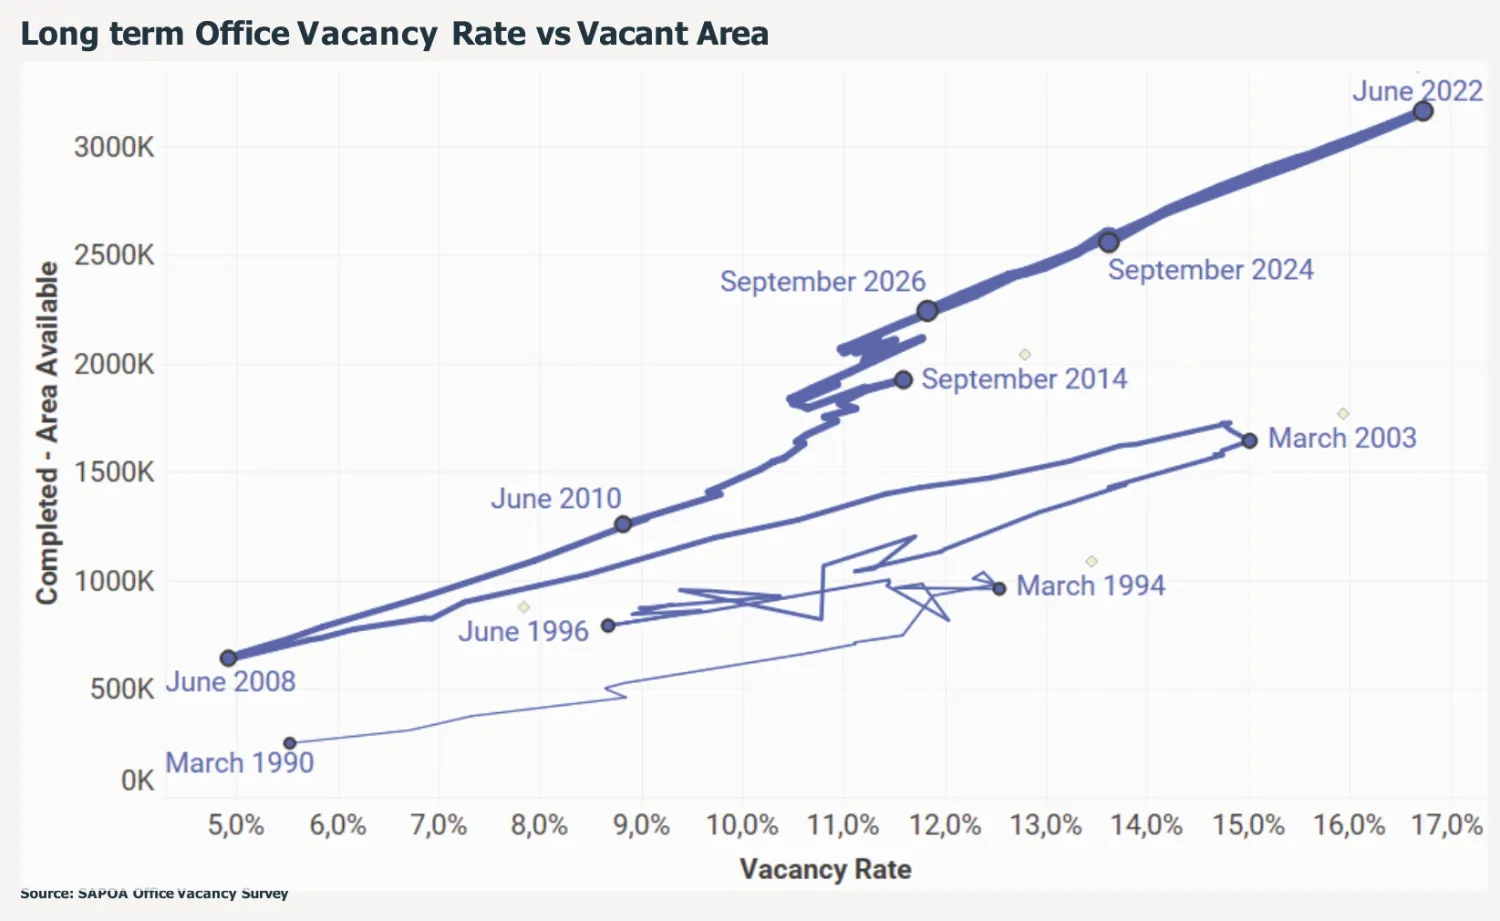
By September 2026 about 2.25 million m² of completed office space was available, down from more than 3.1 million m² in June 2022, when vacancy peaked at 16.8%. Around 920,000 m² of available space has come off the market since then, through absorption and changes to the stock itself, such as conversions. Even so, available space is still above the levels seen at comparable vacancy rates in earlier cycles.
The report’s conclusion is one we share: the recovery has to be measured in both the vacancy rate and the amount of space still being worked through. With so little new supply coming, further absorption, conversions and the repositioning of less competitive buildings should keep the market rebalancing - and because the remaining vacancy is so unevenly spread, asset quality, location and active asset management will decide which buildings benefit.
What This Means for Cape Town Landlords and Tenants
For landlords
- • Decentralised Cape Town stock remains the strongest position in the country. With Rondebosch / Newlands at 0.7%, the Waterfront at 0.8%, Century City at 2.0% and Bellville and Central at 3.1%, reletting risk is minimal. Renew anchor tenants early and lock in escalations.
- • Pricing power is real at the top. Waterfront Prime space is asking R420/m² and Claremont’s median is R231/m². Owners who have held rentals flat have room to reprice at renewal.
- • CBD owners are competing harder. With A-grade CBD vacancy at 10.7% and the Wale-to-Strand and Wale-to-Hans-Strijdom precincts at 19.9% and 16.9%, specification, energy resilience, fit-out contributions and realistic pricing will decide which buildings let first. Owners of older stock with deep vacancy face the same call as last quarter: reposition, change use or accept a lower rental.
For tenants
- • In the decentralised nodes, plan 12 to 18 months ahead of any lease event. Below 3% vacancy, options are limited and landlords hold the pricing power, particularly in Rondebosch / Newlands, the Waterfront and Century City.
- • The CBD is a tenant’s market. There are 38,704 m² of A-grade CBD space available at a median of R212/m² - about half of Waterfront Prime pricing - and far more A-grade choice than at the end of 2025, when A-grade CBD vacancy was 2.2%.
- • New space is scarce. About 34,000 m² is under construction in Cape Town, at asking rentals of R285 to R340/m², and most of what is still available is the 9,177 m² in the CBD. Tenants who want new space should engage early.
Key Takeaways
- • National office vacancy improved to 11.8% in Q3 2026, down from 12.2% in Q2 and the lowest in more than six years, with net absorption of almost 70,000 m².
- • A-, B- and C-grade vacancy all fell, with C-grade improving most to 15.6%. Prime is 4.7% and Prime asking rentals have reached R234/m².
- • Cape Town is still the tightest metro at 6.9%, and Durban (9.3%) and Tshwane (8.9%) have joined it below 10%.
- • Cape Town’s decentralised nodes held at 2.7%, while CBD vacancy rose to 14.0% as A-grade CBD vacancy reached 10.7%.
- • Inside the CBD, vacancy ranges from 7.6% west of Wale Street to 19.9% between Wale and Strand, and two precincts hold about two-thirds of the vacant space.
- • Development has fallen to 100,503 m², just 0.5% of stock, with a 70.4% pre-let rate. Cape Town has 34,000 m² of it.
- • About 2.25 million m² of office space is still available nationally, 920,000 m² less than at the 2022 peak, with distress concentrated in Johannesburg CBD, Milpark and Walmer/Fairview.
Need Cape Town Office Market Intelligence?
Headline numbers only get you so far. Whether you’re re-leasing a portfolio, hunting for the right space, or evaluating an acquisition in the Cape Town office market, Baker Street Properties brings building-level, node-level and tenant-level intelligence to every conversation.
Source: SAPOA / MSCI / Gmaven Office Vacancy Survey, Q3 2026.
Get in TouchNotice and disclaimer
This document and all of the information contained in it, including without limitation all text, data, graphs, charts (collectively, the “Information”) is the property of MSCI Inc. or its subsidiaries (collectively, “MSCI”), or MSCI’s licensors, direct or indirect suppliers or any third party involved in making or compiling any Information (collectively, with MSCI, the “Information Providers”) and is provided for informational purposes only. The Information may not be modified, reverse-engineered, reproduced or redisseminated in whole or in part without prior written permission from MSCI.
The Information may not be used to create derivative works or to verify or correct other data or information. For example (but without limitation), the Information may not be used to create indexes, databases, risk models, analytics, software, or in connection with the issuing, offering, sponsoring, managing or marketing of any securities, portfolios, financial products or other investment vehicles utilizing or based on, linked to, tracking or otherwise derived from the Information or any other MSCI data, information, products or services.
The user of the Information assumes the entire risk of any use it may make or permit to be made of the Information. NONE OF THE INFORMATION PROVIDERS MAKES ANY EXPRESS OR IMPLIED WARRANTIES OR REPRESENTATIONS WITH RESPECT TO THE INFORMATION (OR THE RESULTS TO BE OBTAINED BY THE USE THEREOF), AND TO THE MAXIMUM EXTENT PERMITTED BY APPLICABLE LAW, EACH INFORMATION PROVIDER EXPRESSLY DISCLAIMS ALL IMPLIED WARRANTIES (INCLUDING, WITHOUT LIMITATION, ANY IMPLIED WARRANTIES OF ORIGINALITY, ACCURACY, TIMELINESS, NON-INFRINGEMENT, COMPLETENESS, MERCHANTABILITY AND FITNESS FOR A PARTICULAR PURPOSE) WITH RESPECT TO ANY OF THE INFORMATION.
Without limiting any of the foregoing and to the maximum extent permitted by applicable law, in no event shall any Information Provider have any liability regarding any of the Information for any direct, indirect, special, punitive, consequential (including lost profits) or any other damages even if notified of the possibility of such damages. The foregoing shall not exclude or limit any liability that may not by applicable law be excluded or limited, including without limitation (as applicable), any liability for death or personal injury to the extent that such injury results from the negligence or willful default of itself, its servants, agents or sub-contractors.
Information containing any historical information, data or analysis should not be taken as an indication or guarantee of any future performance, analysis, forecast or prediction. Past performance does not guarantee future results.
The Information should not be relied on and is not a substitute for the skill, judgment and experience of the user, its management, employees, advisors and/or clients when making investment and other business decisions. All Information is impersonal and not tailored to the needs of any person, entity or group of persons.
None of the Information constitutes an offer to sell (or a solicitation of an offer to buy), any security, financial product or other investment vehicle or any trading strategy.
It is not possible to invest directly in an index. Exposure to an asset class or trading strategy or other category represented by an index is only available through third party investable instruments (if any) based on that index. MSCI does not issue, sponsor, endorse, market, offer, review or otherwise express any opinion regarding any fund, ETF, derivative or other security, investment, financial product or trading strategy that is based on, linked to or seeks to provide an investment return related to the performance of any MSCI index (collectively, “Index Linked Investments”). MSCI makes no assurance that any Index Linked Investments will accurately track index performance or provide positive investment returns. MSCI Inc. is not an investment adviser or fiduciary and MSCI makes no representation regarding the advisability of investing in any Index Linked Investments.
Index returns do not represent the results of actual trading of investible assets/securities. MSCI maintains and calculates indexes, but does not manage actual assets. Index returns do not reflect payment of any sales charges or fees an investor may pay to purchase the securities underlying the index or Index Linked Investments. The imposition of these fees and charges would cause the performance of an Index Linked Investment to be different than the MSCI index performance.
The Information may contain back tested data. Back-tested performance is not actual performance, but is hypothetical. There are frequently material differences between back tested performance results and actual results subsequently achieved by any investment strategy.
Constituents of MSCI equity indexes are listed companies, which are included in or excluded from the indexes according to the application of the relevant index methodologies. Accordingly, constituents in MSCI equity indexes may include MSCI Inc., clients of MSCI or suppliers to MSCI. Inclusion of a security within an MSCI index is not a recommendation by MSCI to buy, sell, or hold such security, nor is it considered to be investment advice.
Data and information produced by various affiliates of MSCI Inc., including MSCI ESG Research LLC and Barra LLC, may be used in calculating certain MSCI indexes. More information can be found in the relevant index methodologies on www.msci.com.
MSCI receives compensation in connection with licensing its indexes to third parties. MSCI Inc.’s revenue includes fees based on assets in Index Linked Investments. Information can be found in MSCI Inc.’s company filings on the Investor Relations section of www.msci.com.
MSCI ESG Research LLC is a Registered Investment Adviser under the Investment Advisers Act of 1940 and a subsidiary of MSCI Inc. Except with respect to any applicable products or services from MSCI ESG Research, neither MSCI nor any of its products or services recommends, endorses, approves or otherwise expresses any opinion regarding any issuer, securities, financial products or instruments or trading strategies and MSCI’s products or services are not intended to constitute investment advice or a recommendation to make (or refrain from making) any kind of investment decision and may not be relied on as such. Issuers mentioned or included in any MSCI ESG Research materials may include MSCI Inc., clients of MSCI or suppliers to MSCI, and may also purchase research or other products or services from MSCI ESG Research. MSCI ESG Research materials, including materials utilized in any MSCI ESG Indexes or other products, have not been submitted to, nor received approval from, the United States Securities and Exchange Commission or any other regulatory body.
Any use of or access to products, services or information of MSCI requires a license from MSCI. MSCI, Barra, RiskMetrics, IPD and other MSCI brands and product names are the trademarks, service marks, or registered trademarks of MSCI or its subsidiaries in the United States and other jurisdictions. The Global Industry Classification Standard (GICS) was developed by and is the exclusive property of MSCI and Standard & Poor’s. “Global Industry Classification Standard (GICS)” is a service mark of MSCI and Standard & Poor’s.