
The regional edition of the SAPOA Office Vacancy Survey for the second quarter of 2026 is out. It carries the survey’s national findings, which we covered in our SAPOA Q2 2026 Office Vacancy Report, together with the detailed node-by-node table for the City of Cape Town.
Nationally, office vacancy improved to 12.1% in June 2026, the lowest level since the first quarter of 2020. Cape Town remains the strongest metro in the country at 6.2%, with 172,525 m² of its 2.77 million m² of surveyed office space available to let.
Below we reproduce the whole report section by section with all of its charts, from its definitions to the full Cape Town table of vacancy and asking rentals by grade for all seven of the city’s office nodes, followed by its notice and disclaimer.
Definitions
The report grades office buildings and uses two terms in a specific way. These are its definitions.
| Office Grade | Description |
|---|---|
| Prime Grade | Top quality, modern space. Prime buildings are often considered iconic and a flagship in their market. Essential features include high security, both manned and electronic, the latest generation of building services, ample parking and a prestigious lobby finish. High ceiling heights, flexible floorplates and column spacing. To be considered Prime-grade, an office should be 4-star Green Certified or, in the absence of a formal rating, include equivalent environmental initiatives, which could include zoned lighting, energy-efficient building services and systems, water-efficient fixtures, rainwater harvesting, water-wise landscaping and low-VOC interior finishes. |
| A-Grade | High-quality properties providing good access, professionally managed with continued above-average maintenance. High-quality modern finishes, air conditioning and adequate on-site parking. A clearly articulated entrance and a lobby with clear circulation. High ceiling heights and flexible floorplates likely. |
| B-Grade | Generally older buildings, but accommodation and finishes are close to modern standards because of refurbishment and renovation from time to time. Air conditioning and on-site parking, or bays dedicated to the building, are essential. Minimum ceiling height and less flexible floorplates. Modest landscaping with minimal exterior space. |
| C-Grade | Buildings typically in fair condition but with older-style finishes, services and building systems. Purely functional space with generally limited infrastructure. May or may not be air-conditioned or have on-site parking. Minimal or no lobby, landscaping or exterior space. Unarticulated entrance. |
| Term | Description |
|---|---|
| Gross asking rental | Gross asking rental as published by the landlord. Gross rental is defined as basic rental plus the fixed contractual recoveries payable by the tenant, and excludes metered utility charges like water and electricity. The asking rental could be subject to negotiation and would differ from the rental achieved. |
| Developments | Properties are considered to be in development only when ground has been broken on site. Tenant-driven developments are not included. In the case of phased developments, only the lettable area currently under construction is considered. |
Key Findings
- • National vacancy reaches a post-pandemic low. South Africa’s office vacancy rate declined to 12.1% in Q2 2026, the lowest level since early 2020, reflecting a broad-based recovery across the office market.
- • The recovery broadens across all grades. Vacancy rates improved across all grades during the quarter. Prime and A-grade offices continue to have the strongest market fundamentals, while B-grade recorded the largest quarterly improvement, pointing to a more broad-based recovery.
- • Regional performance remains mixed. Cape Town is the strongest metro at 6.2%, while Gqeberha (15.6%) and Johannesburg (15.1%) have the highest vacancy. Cape Town and Durban are now below their pre-pandemic vacancy rates.
- • Decentralised nodes continue to outperform CBDs. Vacancy in decentralised markets (11.0%) remains well below the CBDs (16.0%), reflecting stronger market fundamentals across most decentralised office locations.
- • Development remains subdued, but pre-leasing is strong. Office development remains limited at 0.7% of existing stock, with just 138,204 m² under construction. However, the pre-let rate increased to 70.7%, highlighting the tenant-driven nature of current development activity.
- • Distress is concentrated in lower-grade buildings. While roughly half of office stock remains fully let across the A-, B- and C-grade segments, vacancy distress is increasingly concentrated in lower-grade buildings and highly vacant properties.
- • The volume of vacant space is still high. Although vacancy rates continue to decline, the market still contains about 2.3 million m² of available office space, a more substantial absorption challenge than in previous cycles.
- • Micro-location increasingly drives performance. Performance continues to diverge within the major office nodes, reinforcing the importance of granular, geocoded analysis in informing leasing, repositioning and capital allocation decisions.
Headline Results
South Africa’s office vacancy rate improved to 12.1% in the second quarter of 2026, the lowest level since the first quarter of 2020, before the COVID-19 pandemic. Of the 54 nodes surveyed, vacancy improved in 23, deteriorated in 18 and was unchanged in the remaining 13.
The survey covered 2,690 completed office properties and active developments across 54 nodes, together about 19.3 million m² of gross lettable area including developments under construction. The market absorbed a net 85,240 m² of office space in the quarter.
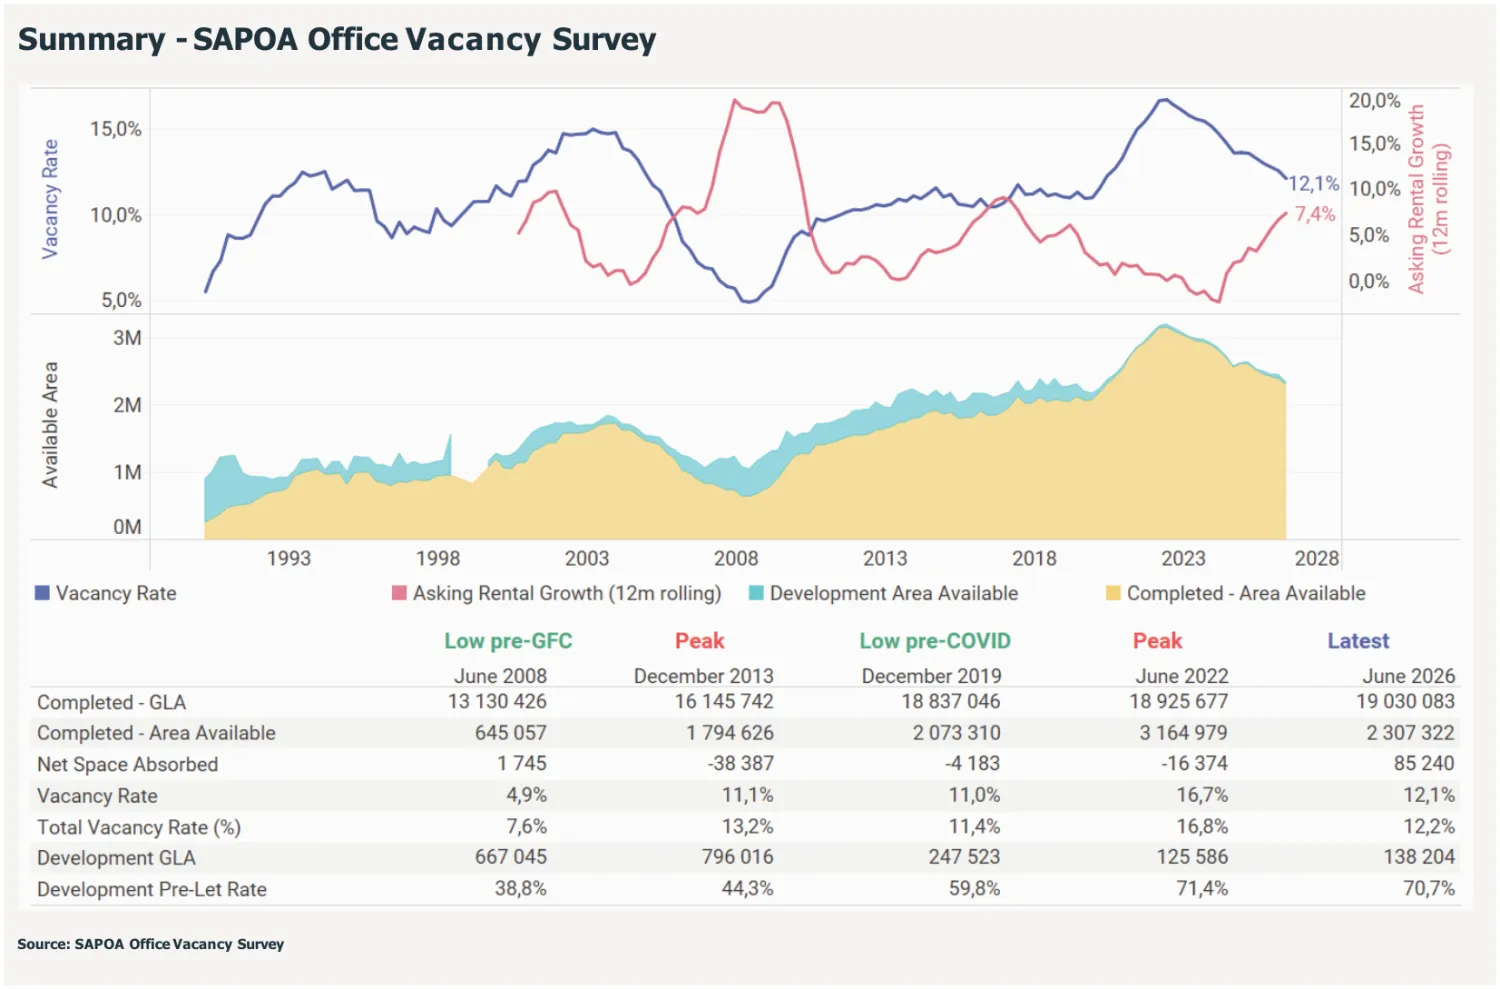
With vacancy continuing to improve from its mid-2022 peak of 16.8%, office fundamentals remain on a gradual recovery path. In line with this improving backdrop, landlords have continued to adjust asking rentals upwards, with year-on-year growth reaching 7.4%. In inflation-adjusted terms, though, asking rentals in many of the country’s major nodes are still below 2019 levels, and rental growth in some nodes has been measured, so a full recovery in real income and capital values is likely to take time.
Office Vacancy by Grade
Office market fundamentals continued to improve in Q2 2026, with vacancy declining across all grades. Higher-quality buildings still outperform on occupancy and rental levels, but the latest results point to a more broadly based recovery. Prime-grade vacancy declined further to 4.6% and A-grade improved to 9.7%. B-grade recorded the largest quarterly improvement, declining to 16.1%, while C-grade eased to 16.5%.
National Office Vacancy by Grade
| Grade | Rentable (m²) | Available (m²) | Jun 2026 | Mar 2026 | Dec 2025 | Sep 2025 | Avg Asking Rental (R/m²) |
|---|---|---|---|---|---|---|---|
| Prime | 2,348,180 | 108,376 | 4.6% | 5.1% | 6.0% | 6.0% | R228 |
| A-Grade | 7,730,802 | 747,620 | 9.7% | 10.2% | 10.5% | 10.8% | R151 |
| B-Grade | 7,071,862 | 1,141,071 | 16.1% | 16.7% | 16.5% | 17.0% | R122 |
| C-Grade | 1,879,239 | 310,255 | 16.5% | 16.8% | 16.5% | 15.7% | R98 |
| All grades | 19,030,083 | 2,307,322 | 12.1% | 12.6% | 12.8% | 13.0% | - |
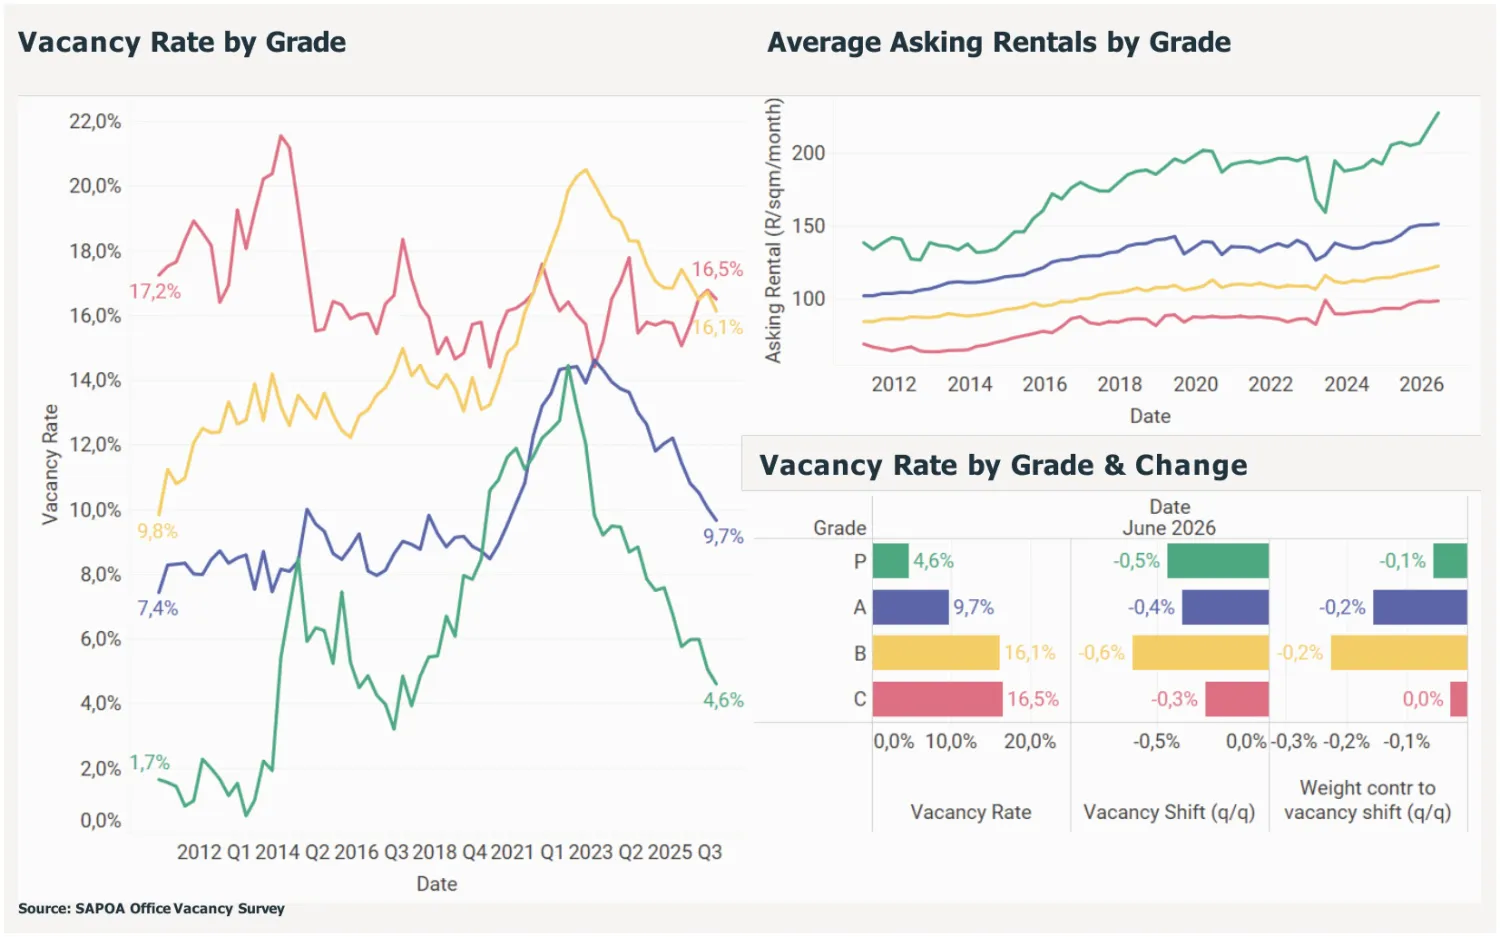
These occupancy trends continue to be reflected in rental performance. Prime offices command the highest asking rentals at an average of R228/m² per month and have shown the strongest rental growth in recent years. A-grade rentals continued to strengthen to R151/m², supported by improving occupancy and steady tenant demand. B- and C-grade asking rentals averaged R122/m² and R98/m²; they have also trended upwards, but growth has been more moderate amid relatively high vacancy.
The link between vacancy and asking rentals holds across the quality spectrum. Segments with lower vacancy continue to have more pricing power, while higher-vacancy segments remain more constrained in their ability to drive rental growth. Although the improvement across all grades suggests the recovery is becoming increasingly broad based, Prime and A-grade stock still show the strongest fundamentals, reinforcing the importance of quality, location and building competitiveness in attracting tenants.
In Cape Town the grades are tighter still: adding up the node table at the end of this article gives Prime vacancy of 1.7%, A-grade 3.5%, B-grade 11.3% and C-grade 17.4%.
Office Vacancy by Region
Regional performance remains uneven, although vacancy has generally improved across the major metros. Gqeberha now has the highest office vacancy in the country at 15.6%, closely followed by Johannesburg at 15.1%. Both have improved from their post-pandemic highs, but demand is still not enough to absorb the available space, particularly in older, less competitive buildings.
Office Vacancy by Metro
| Metro | Rentable (m²) | Available (m²) | Jun 2026 | Mar 2026 | Dec 2025 | Sep 2025 | Versus Q4 2019 |
|---|---|---|---|---|---|---|---|
| City of Cape Town | 2,765,551 | 172,525 | 6.2% | 6.0% | 6.1% | 5.9% | −1.1% |
| City of Tshwane | 4,153,395 | 355,070 | 8.5% | 10.1% | 9.9% | 9.9% | +0.3% |
| eThekwini (Durban) | 1,721,021 | 205,091 | 11.9% | 11.7% | 12.1% | 11.7% | −1.9% |
| City of Johannesburg | 10,251,375 | 1,552,947 | 15.1% | 15.5% | 15.8% | 16.4% | +2.6% |
| Nelson Mandela Bay (Gqeberha) | 138,741 | 21,689 | 15.6% | 15.3% | 15.2% | 15.5% | +5.3% |
| All surveyed nodes | 19,030,083 | 2,307,322 | 12.1% | 12.6% | 12.8% | 13.0% | - |
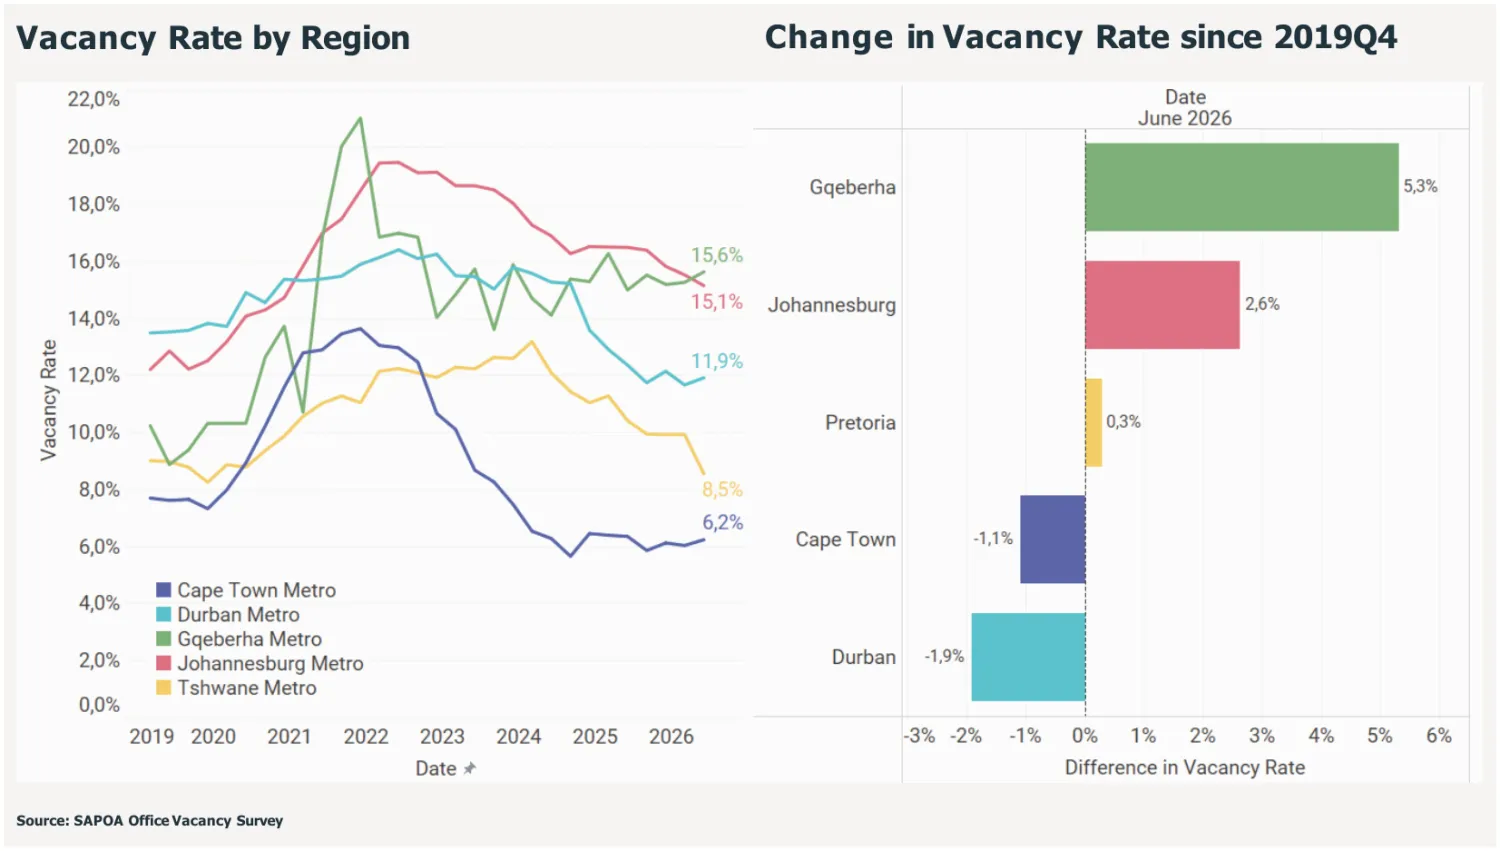
Cape Town Metro remains the strongest office market, with vacancy of 6.2%, the lowest of the major metros and now 1.1 percentage points below its pre-pandemic level, which highlights the market’s resilience and sustained occupier demand. Durban has also recovered well, although off a higher base, with vacancy down to 11.9%, 1.9 percentage points below its pre-pandemic rate.
The recovery has been more gradual in Johannesburg, Tshwane and Gqeberha. Tshwane’s 8.5% is now broadly in line with its 2019 benchmark, only 0.3% above it. Gqeberha, the smallest of the major metros, faces the greatest challenge, with vacancy still well above pre-pandemic levels, and Johannesburg has yet to fully recover, still 2.6% above its pre-pandemic benchmark. Overall, the regional data point to an improving office market, although the pace and extent of recovery vary considerably between metros.
Office Vacancy by Location Type
Vacancy in the country’s major decentralised office nodes remains well below that of the CBDs, at 11.0% against 16.0% nationally, reinforcing the longstanding trend of decentralised markets outperforming CBDs. The persistence of this gap suggests many decentralised nodes have stronger fundamentals, while several CBDs remain held back by high vacancy and weaker demand.
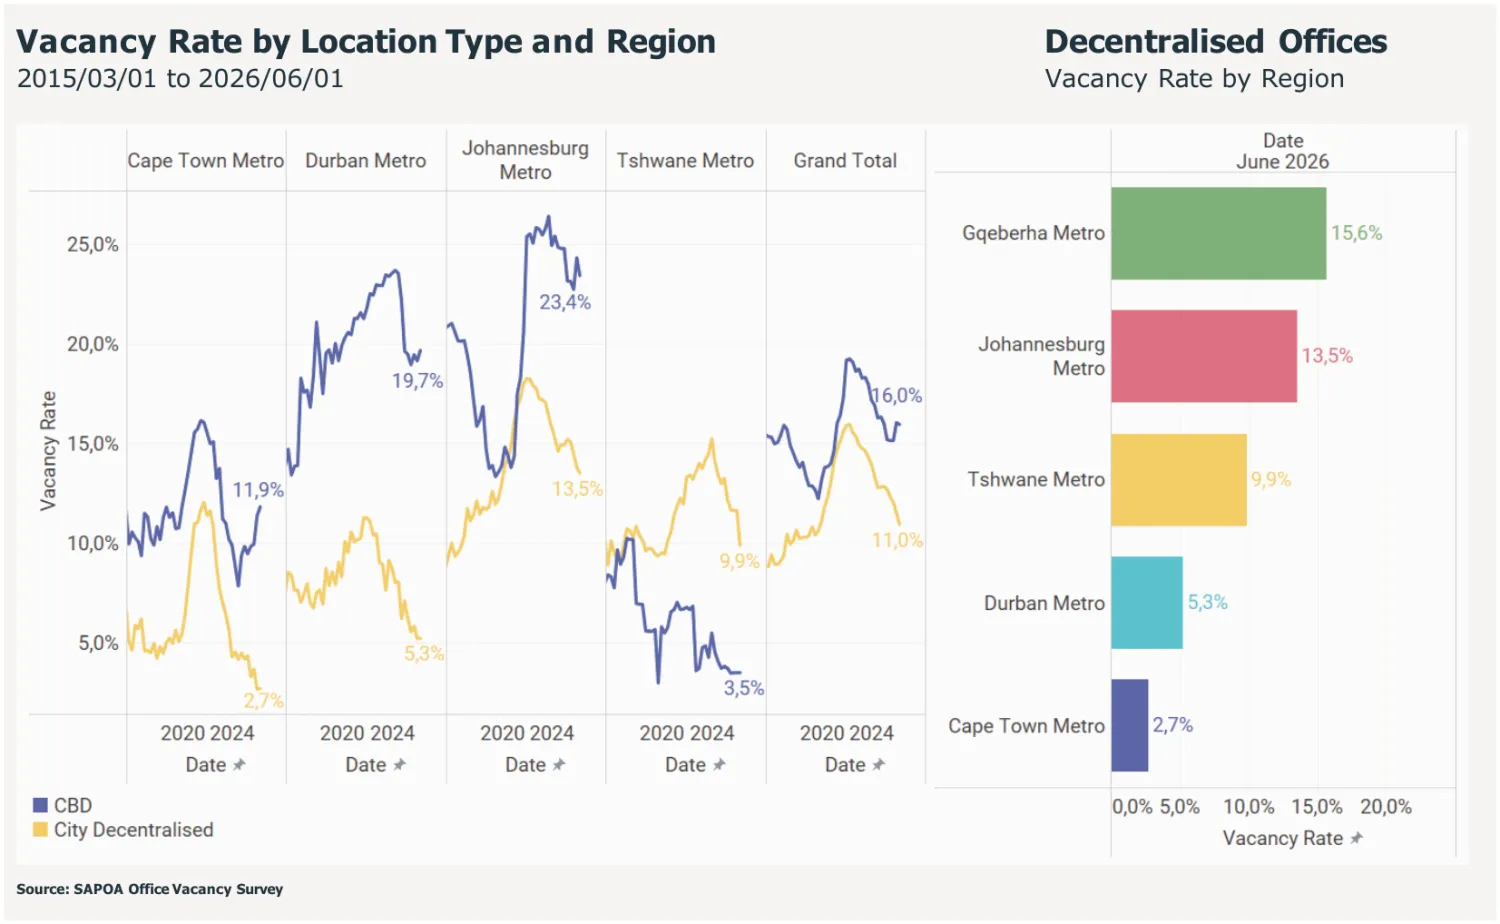
Tshwane is the exception, with CBD vacancy of 3.5%, far lower than most decentralised nodes. This reflects the metro’s unique demand base, with national and provincial government departments continuing to underpin occupancy. Johannesburg has the highest decentralised vacancy at 13.5%, although it has improved from recent peaks, pointing to a gradual recovery in occupier demand.
Cape Town Metro is the strongest decentralised market in the country, with vacancy of just 2.7%, underscoring its sustained demand resilience. Cape Town’s CBD vacancy is still well below Johannesburg’s and Durban’s, but it has trended higher in recent years, in contrast to the continued improvement in the city’s decentralised nodes. Durban’s decentralised vacancy has fallen to 5.3% and Tshwane’s to 9.9%.
Development Activity
Office development remains subdued at 0.7% of existing stock, reflecting cautious market conditions and a continued focus on absorbing existing vacant space. Development tracked by the survey totalled 138,204 m² in Q2 2026, well below the long-term average of about 490,000 m². The pipeline remains constrained, with limited new project starts and far less activity than in previous development cycles. Of the space under construction, 40,486 m² is still available to let.
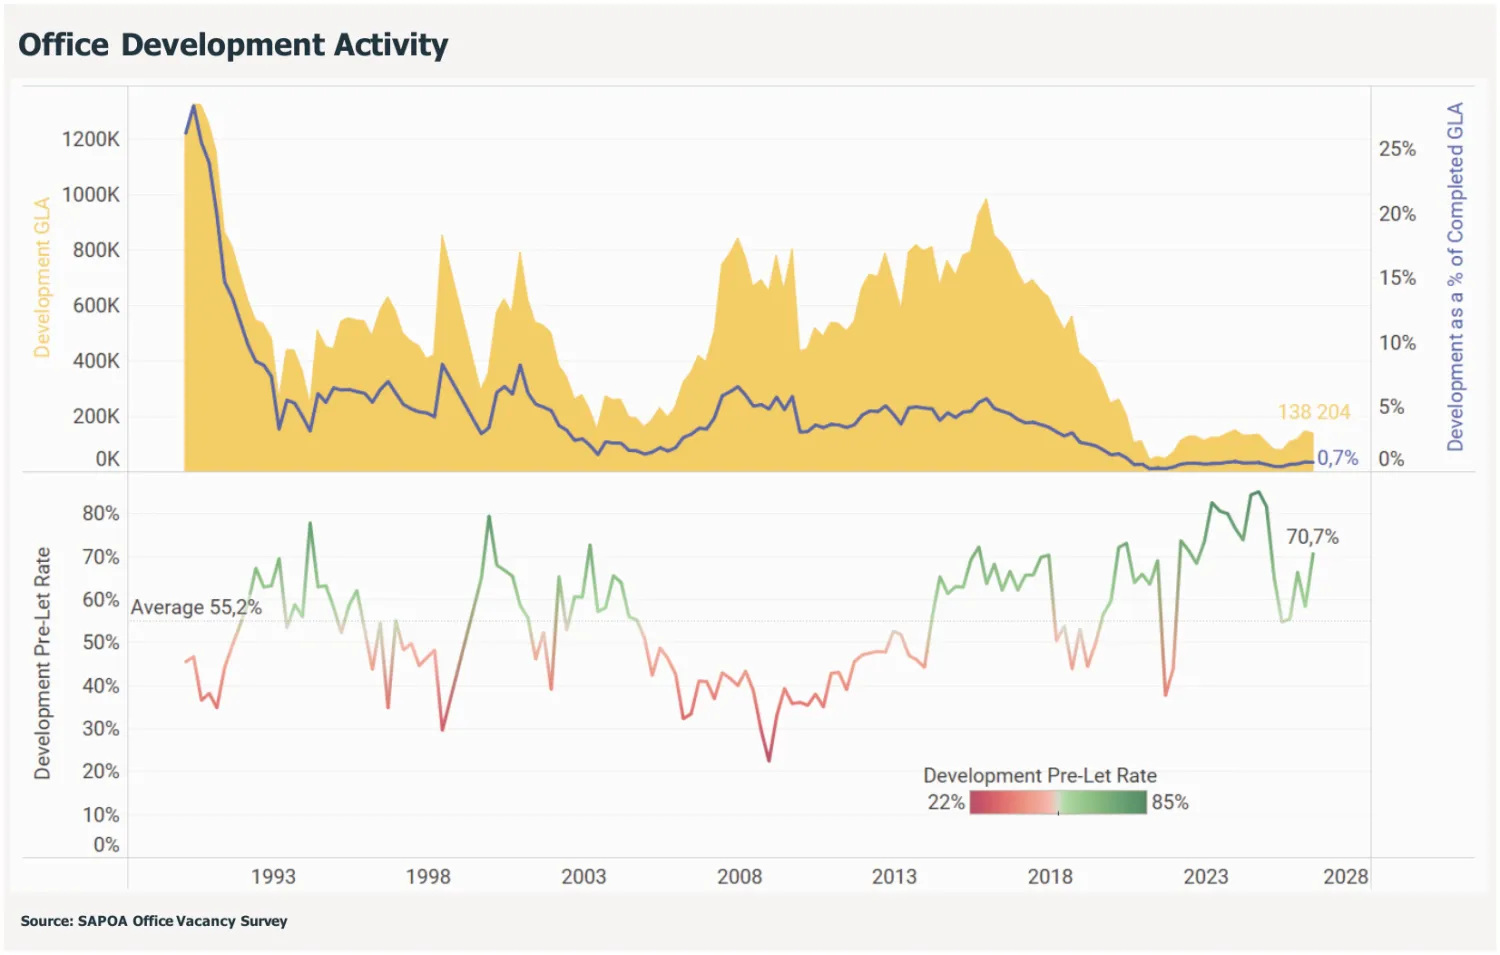
Despite the subdued level of construction, projects under way continue to show strong tenant commitment. The pre-let rate rose to 70.7%, well above the long-term average of 55.2%, which shows new developments remain largely tenant-driven, with developers securing a substantial share of space before completion. With occupiers selective and development risk still elevated, high pre-let levels continue to support the viability of projects proceeding to market.
Limited new supply combined with improving occupancy should help support the ongoing recovery. While speculative development remains constrained, strong pre-leasing shows that demand for well-located, competitive office space is still enough to underpin selected new developments.
Cape Town accounts for 64,000 m² of the national pipeline, close to half: 45,000 m² in the Central node (Pinelands and Black River Park), 10,500 m² in the CBD and 8,500 m² in Century City. The detail is in the Cape Town table below.
Distressed Mid-Quality Offices the Largest Drag on Vacancy
Splitting rentable space by vacancy bracket shows how uneven the recovery is. Roughly half of A-, B- and C-grade stock is fully let, but the rest differs sharply by grade. A-grade offices have a more favourable occupancy profile, with more of their space in the lower vacancy brackets, while B- and especially C-grade buildings make up a disproportionate share of the higher brackets, including buildings more than 50% vacant. This suggests vacancy distress remains concentrated in lower-grade assets despite broader improvements in market fundamentals.
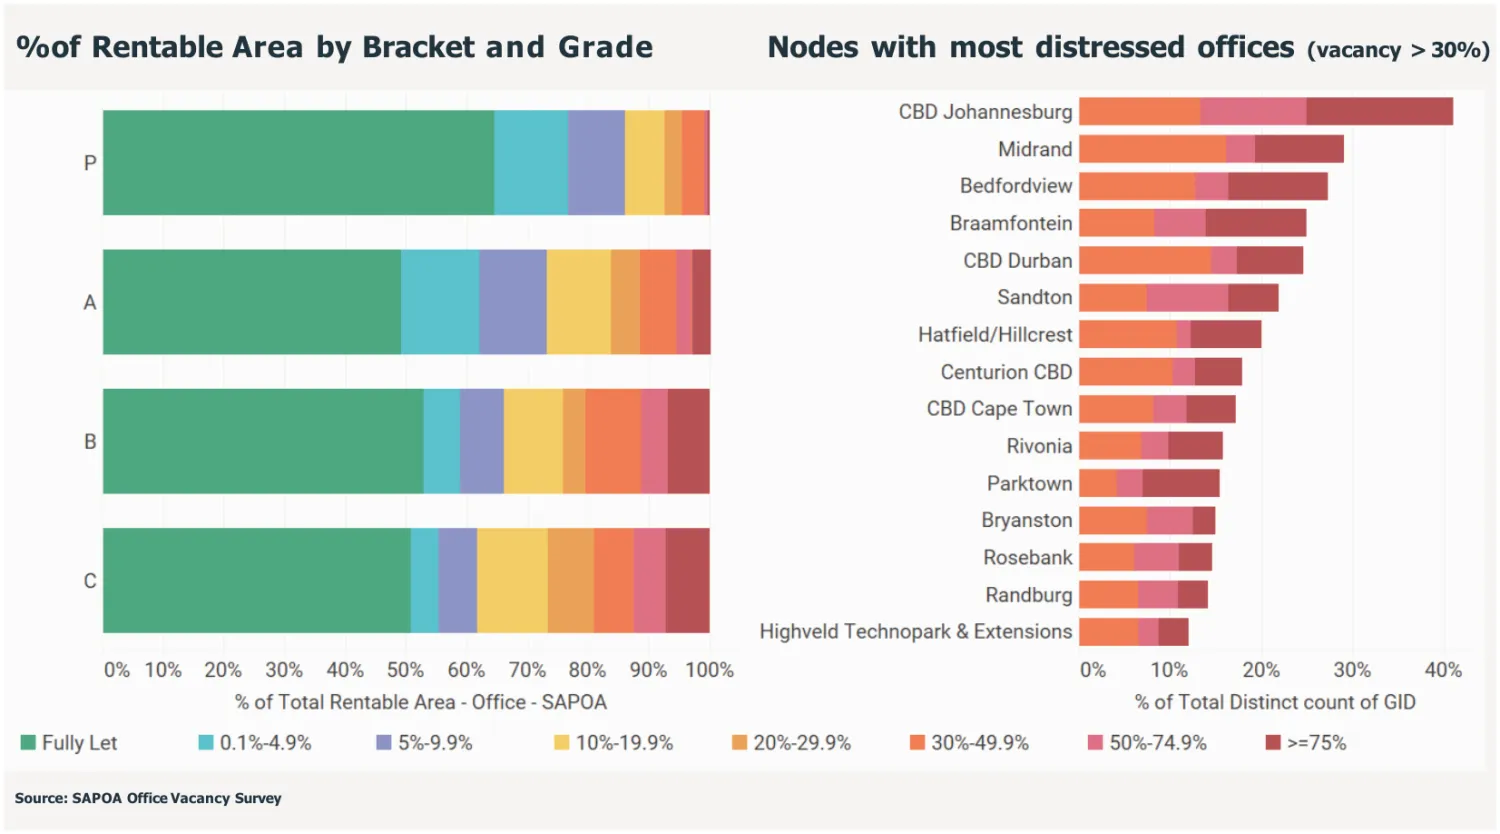
These buildings face real barriers. Many have physical limitations that make them less appealing to modern occupiers, and valuations, refurbishment costs and redevelopment feasibility limit what owners can do. As a result, weaker properties are likely to keep pushing rentals down in the affected nodes, with landlords relying on discounted rents, incentives and other competitive leasing measures.
The concentration of highly vacant buildings in specific nodes further illustrates how uneven the recovery is. Johannesburg CBD has the largest number of distressed office properties, followed by Midrand and Bedfordview. CBD Cape Town also appears on the list. While many office markets are seeing occupancy improve, the persistence of highly vacant buildings in selected locations suggests performance is becoming increasingly polarised, with asset quality, location and building competitiveness playing a more decisive role in leasing outcomes.
Micro-Market Dynamics Within Sandton: Location Still Matters
Sandton is often seen as a bellwether for the South African office market because of its size, the variety of its stock and its wide mix of occupiers. Vacancy has improved from its post-pandemic highs, but the node still faces a large absorption challenge after the volume of space developed in previous cycles.
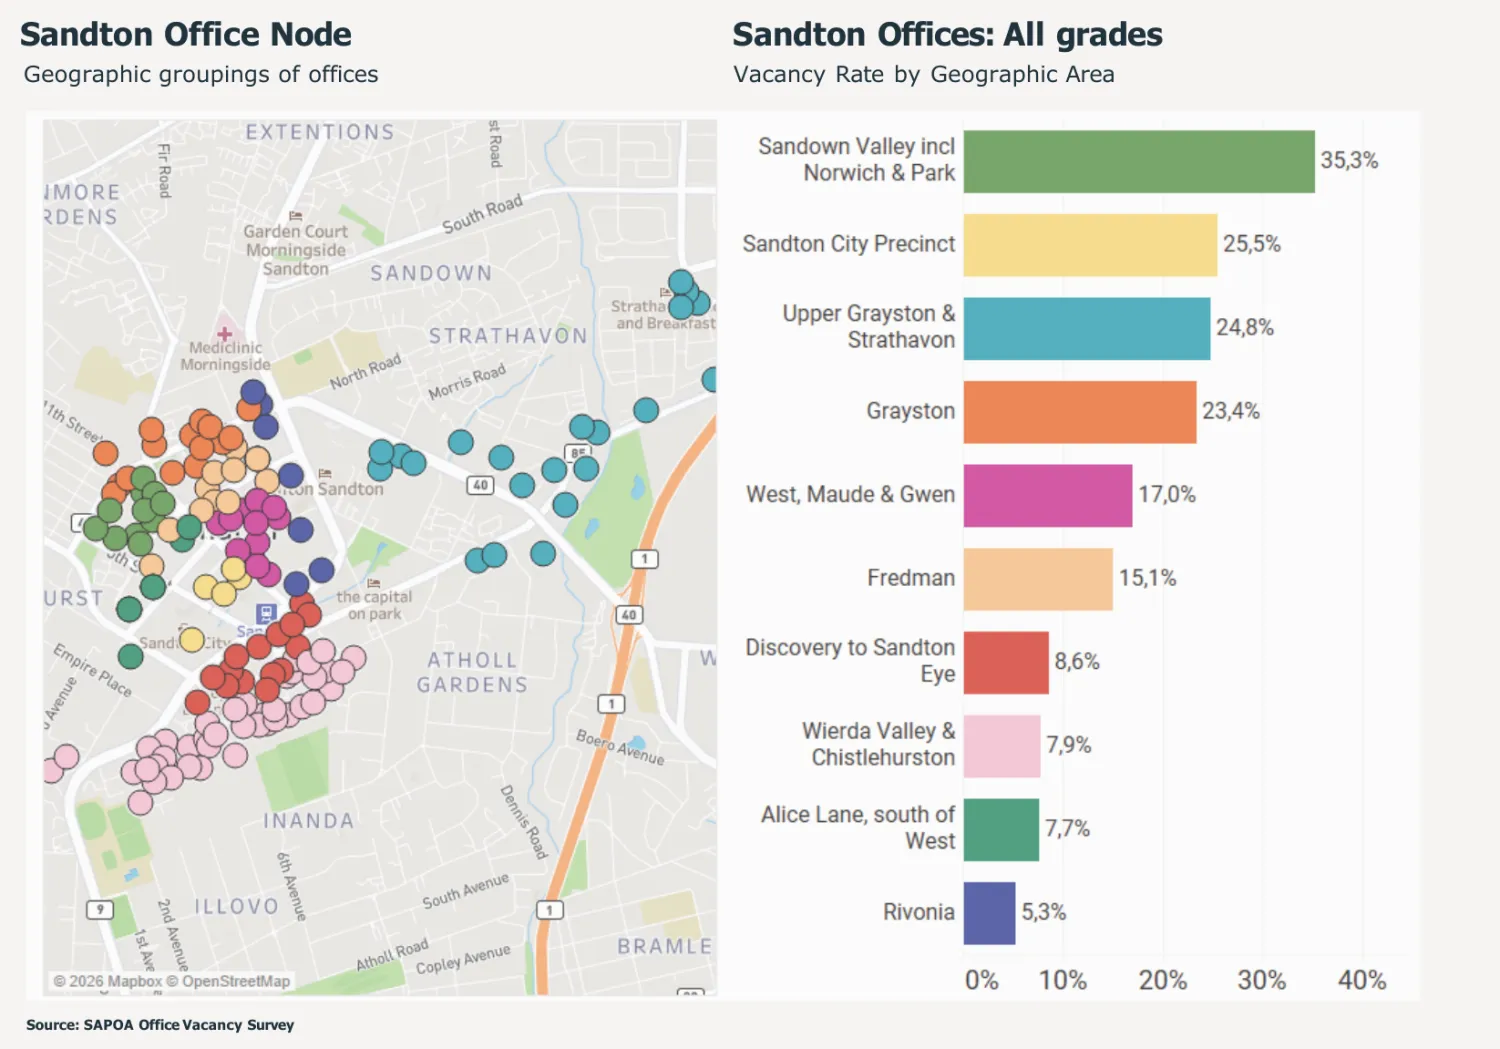
The node average hides a wide spread. Rivonia (5.3%), Alice Lane south of West Street (7.7%) and Wierda Valley and Chislehurston (7.9%) are in single digits, while the Sandton City precinct (25.5%) and Sandown Valley, including Norwich and Park (35.3%), are far above the average. Micro-location, accessibility and building quality are increasingly shaping how offices perform.
These dynamics emphasise the need for granular, location-specific analysis when assessing performance and risk. Spatial and geocoded data can help owners and investors understand how individual buildings are positioned within the wider Sandton node, supporting better-informed leasing, repositioning and capital allocation decisions. The same applies in Cape Town, which is why the node and grade detail at the end of this article matters more than the metro average.
Vacancy Rates Down, but Surplus Space Remains a Challenge
Vacancy rates are a useful barometer of market conditions, but they can hide how much space is actually available. The total volume of vacant office stock adds an important perspective in a market that has grown substantially over time: a vacancy rate similar to a previous cycle can mean far more empty floor space and a correspondingly bigger absorption challenge.
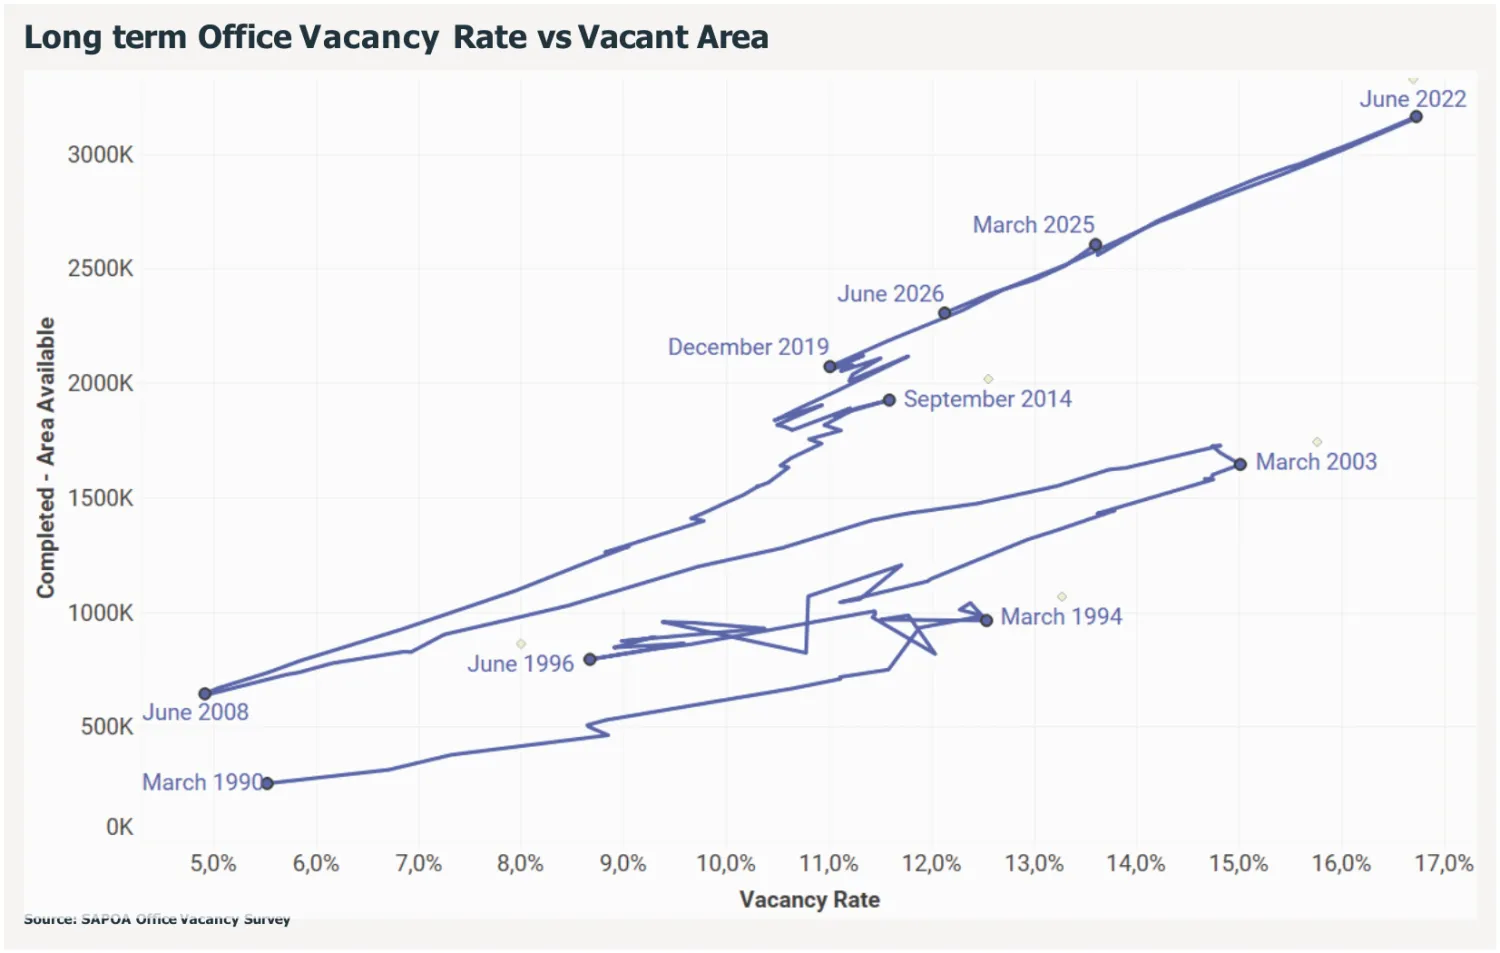
Vacancy has improved from its 2022 peak of 16.8%, but about 2.3 million m² of office space is still available. When the 2003 cycle peaked at a similar vacancy rate of 15.0%, total vacant space was more than 650,000 m² lower. This underscores how the current cycle presents a more substantial absorption challenge than previous downturns, despite the steady improvement in vacancy rates over recent years.
Despite this oversupply, there are still opportunities for proactive owners. Many occupiers are reassessing their space requirements, creating opportunities for well-positioned buildings to capture demand, and buildings that offer flexibility, operational efficiency, strong sustainability credentials or targeted upgrades are best placed to attract them. For landlords, a detailed understanding of node-level dynamics, combined with proactive leasing and asset management, will be critical to improving occupancy and income.
City of Cape Town: Office Node Definitions
The survey divides Cape Town into seven office nodes. The figures in the table below describe the buildings inside these boundaries.
- • Bellville: Jip de Jager / Mike Pienaar to the west, Voortrekker Road to the south, Old Oak to the east and Van Riebeeck Road to the north.
- • CBD Cape Town: Chiappini Street to the west, the Gardens suburb to the south, Tennant Street to the east and the harbour freeway to the north.
- • Century City: properties within the Century City mixed-use node, including offices on either side of Ratanga Road up to Century Boulevard.
- • Claremont: Highwick / Pine to the south, Protea / Campground Road to the north, Palmyra to the east and the M3 to the west.
- • Central: the Pinelands office node and the Black River Park precinct, bounded by Settlers Way to the south, Jan Smuts to the north and east, and Liesbeek Parkway to the west.
- • Rondebosch / Newlands: Protea / Campground Road to the south, Woolsack Road to the north, Campground Road to the east and the M3 to the west.
- • V&A Waterfront: properties within the V&A Waterfront precinct.
City of Cape Town: Vacancy and Asking Rentals by Node
The regional report’s node table gives every Cape Town node’s rentable area, available space and vacancy by grade (P = Prime), how vacancy has moved over the past three quarters, and the lowest, highest and median gross asking rental. Areas are in m² and rentals in rand per m² per month.
| Grade | Rentable | Available | Jun 2026 | Mar 2026 | Dec 2025 | Sep 2025 | Min | Max | Median |
|---|---|---|---|---|---|---|---|---|---|
| Bellville | |||||||||
| P | 52,652 | 0 | 0.0% | 0.0% | 0.0% | 0.0% | - | - | - |
| A | 343,751 | 2,722 | 0.8% | 1.2% | 2.1% | 1.6% | 155 | 250 | 191 |
| B | 144,356 | 13,214 | 9.2% | 8.6% | 9.6% | 8.7% | 100 | 220 | 149 |
| C | 8,218 | 1,836 | 22.3% | 23.1% | 23.1% | 25.0% | 75 | 75 | 75 |
| Total | 548,977 | 17,772 | 3.2% | 3.3% | 4.4% | 3.8% | 75 | 250 | 171 |
| Claremont | |||||||||
| P | 14,327 | 502 | 3.5% | 2.7% | 0.0% | 0.0% | 355 | 360 | 358 |
| A | 71,587 | 3,615 | 5.0% | 3.9% | 2.7% | 2.0% | 180 | 330 | 239 |
| B | 50,028 | 2,976 | 5.9% | 8.3% | 15.7% | 21.7% | 180 | 240 | 206 |
| C | 10,968 | 1,054 | 9.6% | 7.1% | 9.1% | 9.5% | 110 | 240 | 167 |
| Total | 146,910 | 8,147 | 5.5% | 5.5% | 7.4% | 9.0% | 110 | 360 | 230 |
| CBD Cape Town | |||||||||
| P | 71,356 | 3,354 | 4.7% | 5.7% | 2.9% | 4.7% | 284 | 303 | 294 |
| A | 363,060 | 26,795 | 7.4% | 5.8% | 2.2% | 1.5% | 170 | 250 | 216 |
| B | 523,700 | 77,275 | 14.8% | 14.8% | 14.8% | 14.8% | 85 | 195 | 147 |
| C | 102,406 | 18,267 | 17.8% | 17.8% | 17.8% | 17.8% | 67 | 150 | 103 |
| Total | 1,060,522 | 125,691 | 11.9% | 11.4% | 10.0% | 9.9% | 67 | 303 | 151 |
| Rondebosch / Newlands | |||||||||
| A | 90,254 | 2,177 | 2.4% | 1.3% | 4.0% | 3.9% | 135 | 280 | 233 |
| B | 21,352 | 0 | 0.0% | 1.9% | 2.0% | 7.5% | 180 | 190 | 185 |
| Total | 111,606 | 2,177 | 2.0% | 1.4% | 3.6% | 4.8% | 135 | 280 | 219 |
| Century City | |||||||||
| P | 106,128 | 1,360 | 1.3% | 0.0% | 1.0% | 1.0% | 220 | 285 | 252 |
| A | 227,469 | 5,035 | 2.2% | 2.4% | 3.4% | 3.4% | 175 | 245 | 204 |
| B | 49,651 | 367 | 0.7% | 2.1% | 2.3% | 2.3% | 100 | 185 | 148 |
| Total | 383,248 | 6,762 | 1.8% | 1.7% | 2.7% | 2.7% | 100 | 285 | 202 |
| Central (Pinelands & Black River Park) | |||||||||
| P | 60,000 | 0 | 0.0% | 0.0% | 2.3% | 0.0% | - | - | - |
| A | 272,975 | 10,473 | 3.8% | 3.8% | 4.0% | 2.3% | 175 | 235 | 202 |
| B | 36,741 | 186 | 0.5% | 2.4% | 1.8% | 1.9% | 160 | 160 | 160 |
| Total | 369,716 | 10,659 | 2.9% | 3.0% | 3.5% | 1.9% | 160 | 235 | 195 |
| V&A Waterfront | |||||||||
| P | 66,000 | 1,077 | 1.6% | 0.0% | 0.0% | 0.0% | 380 | 380 | 380 |
| A | 72,675 | 240 | 0.3% | 0.8% | 1.7% | 0.8% | 320 | 320 | 320 |
| B | 5,897 | 0 | 0.0% | 0.0% | 0.0% | 0.0% | - | - | - |
| Total | 144,572 | 1,317 | 0.9% | 0.4% | 0.9% | 0.4% | 320 | 380 | 350 |
| City of Cape Town (all seven nodes) | |||||||||
| Total | 2,765,551 | 172,525 | 6.2% | 6.0% | 6.1% | 5.9% | - | - | - |
Gross asking rentals are the basic rental plus fixed contractual recoveries, excluding metered utilities, and may differ from the rental achieved after negotiation. A dash means the report gives no asking rental for that row.
Committed New Developments in Cape Town
| Node | Rentable Area (m²) | Available (m²) | Gross Asking Rental (R/m²) |
|---|---|---|---|
| Central (Pinelands & Black River Park) | 45,000 | 1,000 | R340 |
| CBD Cape Town | 10,500 | 9,177 | R295 |
| Century City | 8,500 | - | R285 |
| All surveyed nodes (national) | 138,204 | 40,486 | - |
What stands out. The CBD holds 1.06 million m², 38% of Cape Town’s office space, but 125,691 m² of the city’s 172,525 m² available, about 73%. Its B-grade buildings alone account for 77,275 m². The six decentralised nodes together are at 2.7%.
The CBD’s rise from 9.9% to 11.9% over the past three quarters came entirely from A-grade, which went from 1.5% to 7.4%, while B- and C-grade did not move. Claremont went the other way, from 9.0% to 5.5%, as its B-grade vacancy fell from 21.7% to 5.9%.
The V&A Waterfront is effectively full at 0.9%, and its Prime space asks the highest rental in the city at R380/m². Of the 10,500 m² under construction in the CBD, 9,177 m² is still available, while Central’s 45,000 m², the largest pipeline of any node in the country, has just 1,000 m² left.
Key Takeaways
- • National office vacancy improved to 12.1% in Q2 2026, the lowest level since early 2020, with vacancy down across every grade.
- • Cape Town is the strongest metro at 6.2%, 1.1 percentage points below its pre-pandemic level, and its decentralised nodes are the tightest in the country at 2.7%.
- • The CBD holds about 73% of Cape Town’s vacant office space, and CBD A-grade vacancy has risen from 1.5% to 7.4% over three quarters.
- • Development is at just 0.7% of stock nationally, with a 70.7% pre-let rate, and 64,000 m² of the 138,204 m² pipeline is in Cape Town.
- • About 2.3 million m² of office space is still available nationally, with distress concentrated in B- and C-grade buildings.
- • Micro-location matters: Sandton’s sub-areas range from 5.3% to 35.3% vacancy, and Cape Town’s nodes range from 0.9% at the V&A Waterfront to 11.9% in the CBD.
Need Cape Town Office Market Intelligence?
Whether you are relocating, expanding, re-leasing a building or weighing up an acquisition, Baker Street Properties can take you from node averages to the specific buildings, rentals and availability that matter for your decision.
Source: SAPOA / MSCI / Gmaven Office Vacancy Survey, Q2 2026 (Regional edition).
Get in TouchBaker Street Properties - First in Property
Tel: +27 (0)21 461 1660 | Email: manager@baker-street.co.za | Website: www.baker-street.co.za
1st Floor, Block B, The Boulevard Office Park, Searle Street, Cape Town, 7925
Registration number: 1996/002055/07 | VAT number: 4310152527
Notice and disclaimer
This document and all of the information contained in it, including without limitation all text, data, graphs, charts (collectively, the “Information”) is the property of MSCI Inc. or its subsidiaries (collectively, “MSCI”), or MSCI’s licensors, direct or indirect suppliers or any third party involved in making or compiling any Information (collectively, with MSCI, the “Information Providers”) and is provided for informational purposes only. The Information may not be modified, reverse-engineered, reproduced or redisseminated in whole or in part without prior written permission from MSCI.
The Information may not be used to create derivative works or to verify or correct other data or information. For example (but without limitation), the Information may not be used to create indexes, databases, risk models, analytics, software, or in connection with the issuing, offering, sponsoring, managing or marketing of any securities, portfolios, financial products or other investment vehicles utilizing or based on, linked to, tracking or otherwise derived from the Information or any other MSCI data, information, products or services.
The user of the Information assumes the entire risk of any use it may make or permit to be made of the Information. NONE OF THE INFORMATION PROVIDERS MAKES ANY EXPRESS OR IMPLIED WARRANTIES OR REPRESENTATIONS WITH RESPECT TO THE INFORMATION (OR THE RESULTS TO BE OBTAINED BY THE USE THEREOF), AND TO THE MAXIMUM EXTENT PERMITTED BY APPLICABLE LAW, EACH INFORMATION PROVIDER EXPRESSLY DISCLAIMS ALL IMPLIED WARRANTIES (INCLUDING, WITHOUT LIMITATION, ANY IMPLIED WARRANTIES OF ORIGINALITY, ACCURACY, TIMELINESS, NON-INFRINGEMENT, COMPLETENESS, MERCHANTABILITY AND FITNESS FOR A PARTICULAR PURPOSE) WITH RESPECT TO ANY OF THE INFORMATION.
Without limiting any of the foregoing and to the maximum extent permitted by applicable law, in no event shall any Information Provider have any liability regarding any of the Information for any direct, indirect, special, punitive, consequential (including lost profits) or any other damages even if notified of the possibility of such damages. The foregoing shall not exclude or limit any liability that may not by applicable law be excluded or limited, including without limitation (as applicable), any liability for death or personal injury to the extent that such injury results from the negligence or willful default of itself, its servants, agents or sub-contractors.
Information containing any historical information, data or analysis should not be taken as an indication or guarantee of any future performance, analysis, forecast or prediction. Past performance does not guarantee future results.
The Information should not be relied on and is not a substitute for the skill, judgment and experience of the user, its management, employees, advisors and/or clients when making investment and other business decisions. All Information is impersonal and not tailored to the needs of any person, entity or group of persons.
None of the Information constitutes an offer to sell (or a solicitation of an offer to buy), any security, financial product or other investment vehicle or any trading strategy.
It is not possible to invest directly in an index. Exposure to an asset class or trading strategy or other category represented by an index is only available through third party investable instruments (if any) based on that index. MSCI does not issue, sponsor, endorse, market, offer, review or otherwise express any opinion regarding any fund, ETF, derivative or other security, investment, financial product or trading strategy that is based on, linked to or seeks to provide an investment return related to the performance of any MSCI index (collectively, “Index Linked Investments”). MSCI makes no assurance that any Index Linked Investments will accurately track index performance or provide positive investment returns. MSCI Inc. is not an investment adviser or fiduciary and MSCI makes no representation regarding the advisability of investing in any Index Linked Investments.
Index returns do not represent the results of actual trading of investible assets/securities. MSCI maintains and calculates indexes, but does not manage actual assets. Index returns do not reflect payment of any sales charges or fees an investor may pay to purchase the securities underlying the index or Index Linked Investments. The imposition of these fees and charges would cause the performance of an Index Linked Investment to be different than the MSCI index performance.
The Information may contain back tested data. Back-tested performance is not actual performance, but is hypothetical. There are frequently material differences between back tested performance results and actual results subsequently achieved by any investment strategy.
Constituents of MSCI equity indexes are listed companies, which are included in or excluded from the indexes according to the application of the relevant index methodologies. Accordingly, constituents in MSCI equity indexes may include MSCI Inc., clients of MSCI or suppliers to MSCI. Inclusion of a security within an MSCI index is not a recommendation by MSCI to buy, sell, or hold such security, nor is it considered to be investment advice.
Data and information produced by various affiliates of MSCI Inc., including MSCI ESG Research LLC and Barra LLC, may be used in calculating certain MSCI indexes. More information can be found in the relevant index methodologies on www.msci.com.
MSCI receives compensation in connection with licensing its indexes to third parties. MSCI Inc.’s revenue includes fees based on assets in Index Linked Investments. Information can be found in MSCI Inc.’s company filings on the Investor Relations section of www.msci.com.
MSCI ESG Research LLC is a Registered Investment Adviser under the Investment Advisers Act of 1940 and a subsidiary of MSCI Inc. Except with respect to any applicable products or services from MSCI ESG Research, neither MSCI nor any of its products or services recommends, endorses, approves or otherwise expresses any opinion regarding any issuer, securities, financial products or instruments or trading strategies and MSCI’s products or services are not intended to constitute investment advice or a recommendation to make (or refrain from making) any kind of investment decision and may not be relied on as such. Issuers mentioned or included in any MSCI ESG Research materials may include MSCI Inc., clients of MSCI or suppliers to MSCI, and may also purchase research or other products or services from MSCI ESG Research. MSCI ESG Research materials, including materials utilized in any MSCI ESG Indexes or other products, have not been submitted to, nor received approval from, the United States Securities and Exchange Commission or any other regulatory body.
Any use of or access to products, services or information of MSCI requires a license from MSCI. MSCI, Barra, RiskMetrics, IPD and other MSCI brands and product names are the trademarks, service marks, or registered trademarks of MSCI or its subsidiaries in the United States and other jurisdictions. The Global Industry Classification Standard (GICS) was developed by and is the exclusive property of MSCI and Standard & Poor’s. “Global Industry Classification Standard (GICS)” is a service mark of MSCI and Standard & Poor’s.